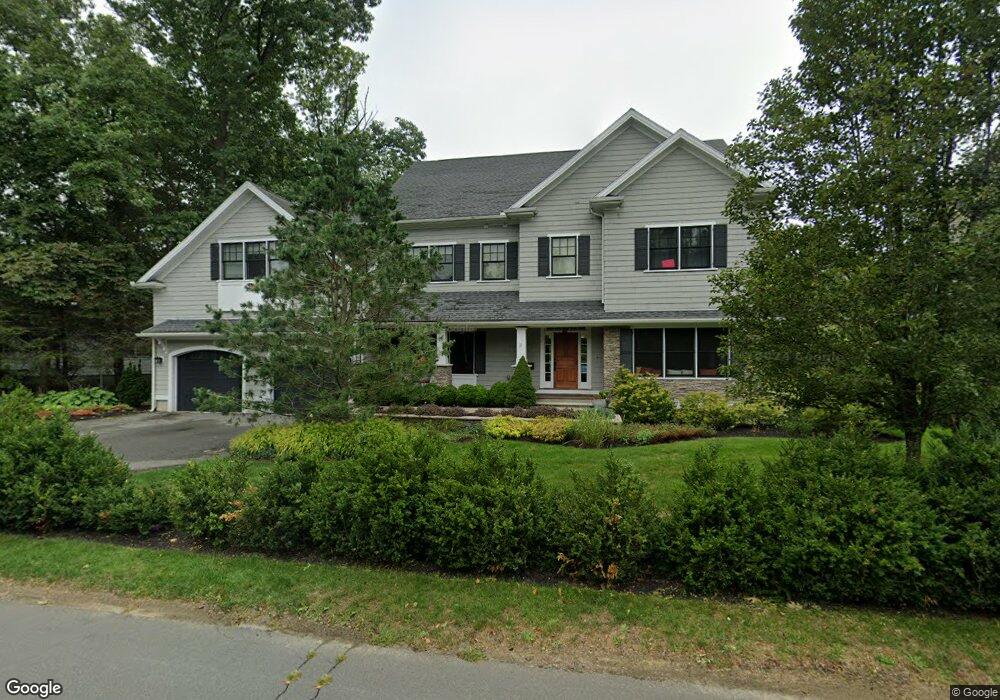
11 Foster Rd Lexington, MA 02421
Munroe Hill NeighborhoodEstimated Value: $3,196,936 - $4,427,000
6
Beds
6
Baths
5,473
Sq Ft
$667/Sq Ft
Est. Value
About This Home
This home is located at 11 Foster Rd, Lexington, MA 02421 and is currently estimated at $3,649,984, approximately $666 per square foot. 11 Foster Rd is a home located in Middlesex County with nearby schools including Harrington Elementary School, Jonas Clarke Middle School, and Lexington High School.
Ownership History
Date
Name
Owned For
Owner Type
Purchase Details
Closed on
Oct 21, 2011
Sold by
11 Foster Road Llc
Bought by
Harrison-Kahan Lori and Kahan David
Current Estimated Value
Home Financials for this Owner
Home Financials are based on the most recent Mortgage that was taken out on this home.
Original Mortgage
$1,331,250
Outstanding Balance
$910,151
Interest Rate
4.15%
Mortgage Type
Purchase Money Mortgage
Estimated Equity
$2,739,833
Purchase Details
Closed on
Nov 29, 2010
Sold by
Guernsey Keith D and Guernsey Gordon L
Bought by
11 Foster Road Llc
Home Financials for this Owner
Home Financials are based on the most recent Mortgage that was taken out on this home.
Original Mortgage
$1,075,000
Interest Rate
4.25%
Mortgage Type
Purchase Money Mortgage
Create a Home Valuation Report for This Property
The Home Valuation Report is an in-depth analysis detailing your home's value as well as a comparison with similar homes in the area
Home Values in the Area
Average Home Value in this Area
Purchase History
| Date | Buyer | Sale Price | Title Company |
|---|---|---|---|
| Harrison-Kahan Lori | $1,775,000 | -- | |
| 11 Foster Road Llc | $700,000 | -- |
Source: Public Records
Mortgage History
| Date | Status | Borrower | Loan Amount |
|---|---|---|---|
| Open | Harrison-Kahan Lori | $1,331,250 | |
| Previous Owner | 11 Foster Road Llc | $1,075,000 |
Source: Public Records
Tax History
| Year | Tax Paid | Tax Assessment Tax Assessment Total Assessment is a certain percentage of the fair market value that is determined by local assessors to be the total taxable value of land and additions on the property. | Land | Improvement |
|---|---|---|---|---|
| 2025 | $32,581 | $2,664,000 | $898,000 | $1,766,000 |
| 2024 | $30,944 | $2,526,000 | $855,000 | $1,671,000 |
| 2023 | $28,769 | $2,213,000 | $777,000 | $1,436,000 |
| 2022 | $28,911 | $2,095,000 | $707,000 | $1,388,000 |
| 2021 | $9,411 | $1,941,000 | $701,000 | $1,240,000 |
| 2020 | $28,198 | $2,007,000 | $701,000 | $1,306,000 |
| 2019 | $8,782 | $1,929,000 | $668,000 | $1,261,000 |
| 2018 | $5,430 | $1,886,000 | $636,000 | $1,250,000 |
| 2017 | $25,792 | $1,780,000 | $606,000 | $1,174,000 |
| 2016 | $26,324 | $1,803,000 | $577,000 | $1,226,000 |
| 2015 | $25,723 | $1,731,000 | $525,000 | $1,206,000 |
| 2014 | $26,320 | $1,697,000 | $477,000 | $1,220,000 |
Source: Public Records
Map
Nearby Homes
- 8 Dane Rd
- 65 Sherburne Rd S
- 42 Winthrop Rd
- 3 Effie Place
- 51 Bloomfield St
- 178 Waltham St
- 15 Slocum Rd
- 367 Waltham St Unit 5
- 10 Eliot Rd
- 1437 Massachusetts Ave
- 2 Beech Tree Ln
- 9 Pelham Rd
- 32 Forest St
- 18 Baskin Rd
- 17 Prospect Hill Rd
- 2 Effie Place
- 1894 Massachusetts Ave
- 1900 Massachusetts Ave
- 72 Grassland St
- 16 Meriam St
Your Personal Tour Guide
Ask me questions while you tour the home.