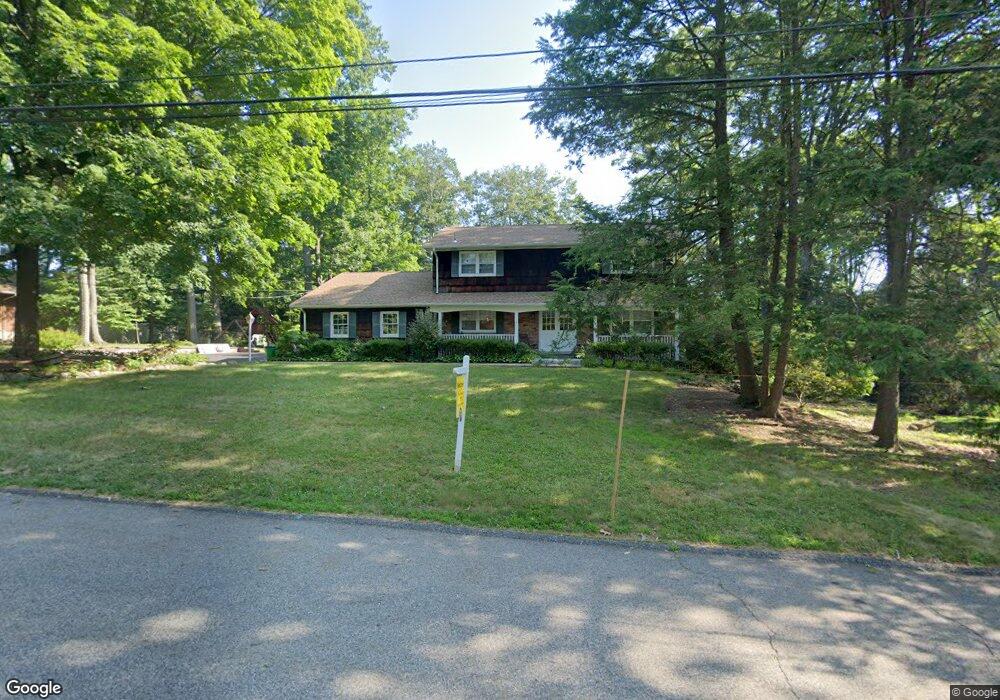
11 Fox Hill Rd Spring Valley, NY 10977
Estimated Value: $966,000 - $1,267,000
4
Beds
3
Baths
3,482
Sq Ft
$328/Sq Ft
Est. Value
About This Home
This home is located at 11 Fox Hill Rd, Spring Valley, NY 10977 and is currently estimated at $1,143,392, approximately $328 per square foot. 11 Fox Hill Rd is a home located in Rockland County with nearby schools including Fleetwood Elementary School, Chestnut Ridge Middle School, and Spring Valley High School.
Ownership History
Date
Name
Owned For
Owner Type
Purchase Details
Closed on
Sep 27, 2019
Sold by
Friedman Joel
Bought by
Barnstable Equities Trust
Current Estimated Value
Purchase Details
Closed on
Mar 28, 2016
Sold by
Goodman Leonard S and Goodman Helen E
Bought by
Friedman Joel
Home Financials for this Owner
Home Financials are based on the most recent Mortgage that was taken out on this home.
Original Mortgage
$617,500
Interest Rate
3.62%
Mortgage Type
New Conventional
Create a Home Valuation Report for This Property
The Home Valuation Report is an in-depth analysis detailing your home's value as well as a comparison with similar homes in the area
Home Values in the Area
Average Home Value in this Area
Purchase History
| Date | Buyer | Sale Price | Title Company |
|---|---|---|---|
| Barnstable Equities Trust | -- | None Available | |
| Friedman Joel | $650,000 | Land Track Title |
Source: Public Records
Mortgage History
| Date | Status | Borrower | Loan Amount |
|---|---|---|---|
| Previous Owner | Friedman Joel | $617,500 |
Source: Public Records
Tax History Compared to Growth
Tax History
| Year | Tax Paid | Tax Assessment Tax Assessment Total Assessment is a certain percentage of the fair market value that is determined by local assessors to be the total taxable value of land and additions on the property. | Land | Improvement |
|---|---|---|---|---|
| 2024 | $15,875 | $66,000 | $17,600 | $48,400 |
| 2023 | $15,875 | $66,000 | $17,600 | $48,400 |
| 2022 | $14,809 | $66,000 | $17,600 | $48,400 |
| 2021 | $14,736 | $66,000 | $17,600 | $48,400 |
| 2020 | $15,678 | $66,000 | $17,600 | $48,400 |
| 2019 | $15,738 | $66,000 | $17,600 | $48,400 |
| 2018 | $15,738 | $66,000 | $17,600 | $48,400 |
| 2017 | $15,644 | $66,000 | $17,600 | $48,400 |
| 2016 | $14,570 | $66,000 | $17,600 | $48,400 |
| 2015 | -- | $66,000 | $17,600 | $48,400 |
| 2014 | -- | $66,000 | $17,600 | $48,400 |
Source: Public Records
Map
Nearby Homes