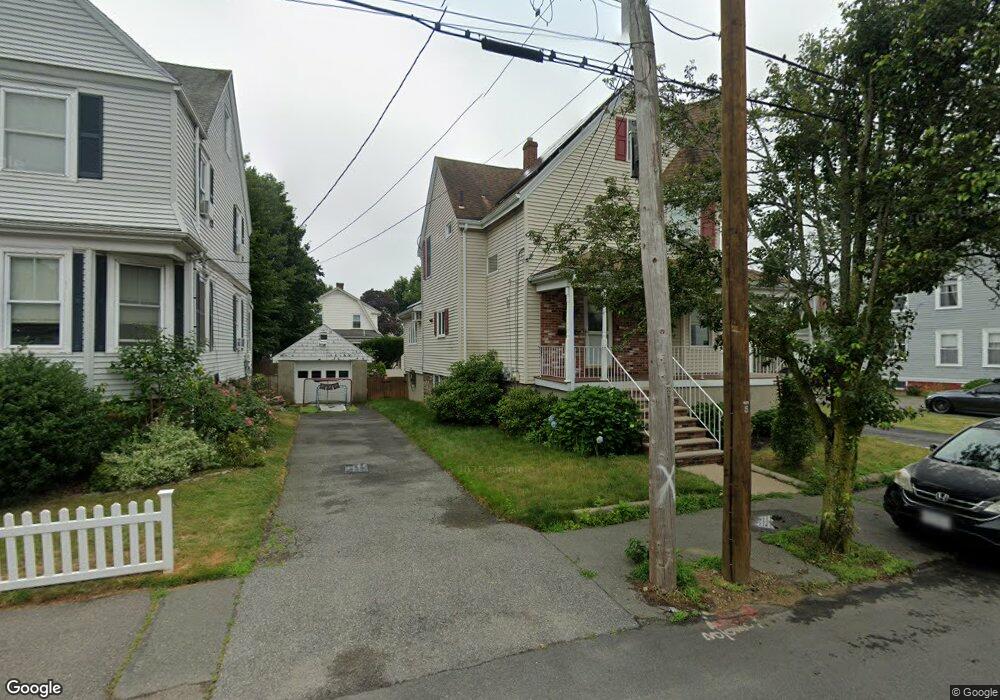
11 Franklin Ave Swampscott, MA 01907
Estimated Value: $710,961 - $813,000
3
Beds
1
Bath
1,706
Sq Ft
$455/Sq Ft
Est. Value
About This Home
This home is located at 11 Franklin Ave, Swampscott, MA 01907 and is currently estimated at $776,990, approximately $455 per square foot. 11 Franklin Ave is a home located in Essex County with nearby schools including Swampscott Middle School and Swampscott High School.
Ownership History
Date
Name
Owned For
Owner Type
Purchase Details
Closed on
Feb 3, 2017
Sold by
Morris George E and Morris Elizabeth A
Bought by
Speciale Daniel E and Karas Beth S
Current Estimated Value
Home Financials for this Owner
Home Financials are based on the most recent Mortgage that was taken out on this home.
Original Mortgage
$425,315
Outstanding Balance
$344,070
Interest Rate
3.75%
Mortgage Type
FHA
Estimated Equity
$432,920
Purchase Details
Closed on
Dec 31, 2001
Sold by
Humphrey Stephen S and Humphrey Courtney
Bought by
Morris George E and Morris Elizabeth A
Purchase Details
Closed on
Jun 28, 1999
Sold by
Hornung Scott and Hornung Debra C
Bought by
Humphrey Stephen S and Humphrey Courtney A
Purchase Details
Closed on
Sep 10, 1990
Sold by
Perry Christopher
Bought by
Hornung Scott T
Create a Home Valuation Report for This Property
The Home Valuation Report is an in-depth analysis detailing your home's value as well as a comparison with similar homes in the area
Home Values in the Area
Average Home Value in this Area
Purchase History
| Date | Buyer | Sale Price | Title Company |
|---|---|---|---|
| Speciale Daniel E | $440,000 | -- | |
| Speciale Daniel E | $440,000 | -- | |
| Morris George E | $286,500 | -- | |
| Morris George E | $286,500 | -- | |
| Humphrey Stephen S | $239,000 | -- | |
| Humphrey Stephen S | $239,000 | -- | |
| Hornung Scott T | $171,250 | -- |
Source: Public Records
Mortgage History
| Date | Status | Borrower | Loan Amount |
|---|---|---|---|
| Open | Speciale Daniel E | $425,315 | |
| Closed | Speciale Daniel E | $425,315 | |
| Previous Owner | Hornung Scott T | $268,000 | |
| Previous Owner | Hornung Scott T | $270,000 |
Source: Public Records
Tax History
| Year | Tax Paid | Tax Assessment Tax Assessment Total Assessment is a certain percentage of the fair market value that is determined by local assessors to be the total taxable value of land and additions on the property. | Land | Improvement |
|---|---|---|---|---|
| 2025 | $7,101 | $619,100 | $287,100 | $332,000 |
| 2024 | $6,933 | $603,400 | $274,800 | $328,600 |
| 2023 | $6,645 | $566,000 | $262,500 | $303,500 |
| 2022 | $6,283 | $489,700 | $229,700 | $260,000 |
| 2021 | $6,457 | $467,900 | $213,300 | $254,600 |
| 2020 | $6,229 | $435,600 | $184,600 | $251,000 |
| 2019 | $6,398 | $420,900 | $139,400 | $281,500 |
| 2018 | $6,547 | $409,200 | $131,200 | $278,000 |
| 2017 | $6,095 | $349,300 | $123,000 | $226,300 |
| 2016 | $6,053 | $349,300 | $123,000 | $226,300 |
| 2015 | $5,850 | $341,100 | $114,800 | $226,300 |
| 2014 | $5,249 | $280,700 | $86,100 | $194,600 |
Source: Public Records
Map
Nearby Homes
- 64 Stetson Ave
- 46 Stetson Ave
- 178 Norfolk Ave
- 106 Norfolk Ave
- 80 Norfolk Ave Unit 1
- 40 Andrew Rd
- 306 Paradise Rd
- 50 Mountwood Rd
- 51 Mountwood Rd
- 40 Buena Vista St
- 146 Burrill St
- 3 Didio Dr
- 11 Boynton St Unit 104
- 11 Boynton St Unit 101
- 11 Boynton St Unit 102
- 11 Boynton St Unit 103
- 11 Boynton St Unit 204
- 108-110 Burrill St Unit 1
- 60 Roy St
- 445 Essex St Unit 304
- 17 Franklin Ave
- 9 Franklin Ave
- 21 Franklin Ave
- 28-30 Suffolk Ave Unit 1
- 28-30 Suffolk Ave
- 3 Franklin Ave
- 32 Suffolk Ave Unit 34
- 28 Suffolk Ave Unit 30
- 25 Franklin Ave
- 18 Franklin Ave
- 63 Stetson Ave
- 20 Franklin Ave
- 38 Suffolk Ave
- 18 Suffolk Ave
- 67 Stetson Ave Unit 2
- 65 Stetson Ave Unit 67
- 65 Stetson Ave Unit 2
- 29 Franklin Ave
- 45 Stetson Ave
- 42 Suffolk Ave
Your Personal Tour Guide
Ask me questions while you tour the home.