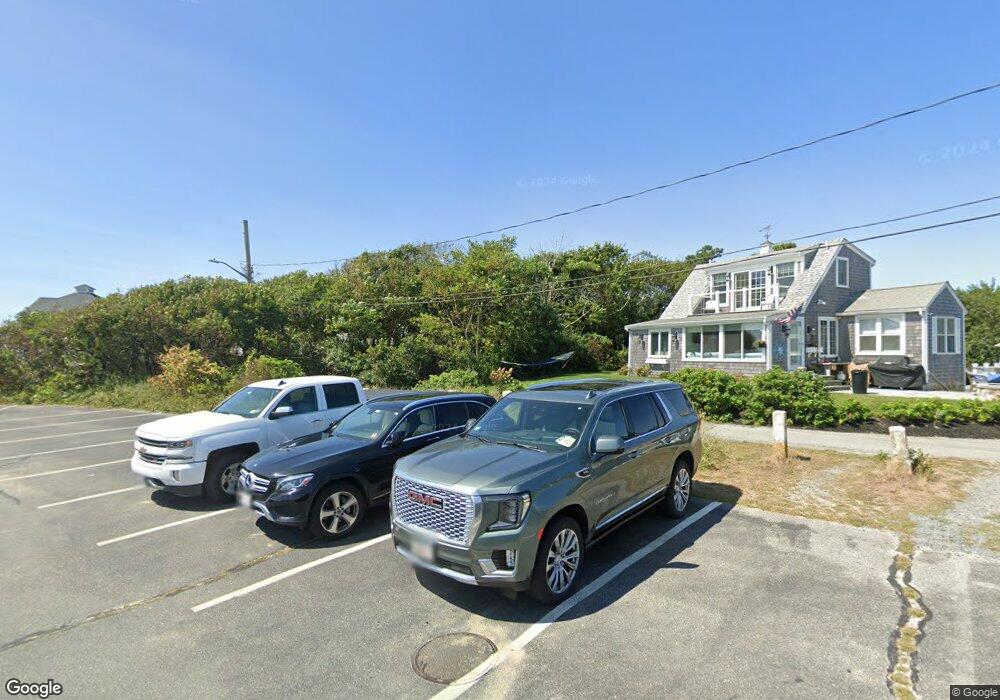
11 Franklin Rd Dennis Port, MA 02639
Dennis Port NeighborhoodEstimated Value: $858,000 - $1,196,000
3
Beds
3
Baths
1,689
Sq Ft
$616/Sq Ft
Est. Value
About This Home
This home is located at 11 Franklin Rd, Dennis Port, MA 02639 and is currently estimated at $1,040,852, approximately $616 per square foot. 11 Franklin Rd is a home located in Barnstable County with nearby schools including Dennis-Yarmouth Regional High School and St. Pius X. School.
Ownership History
Date
Name
Owned For
Owner Type
Purchase Details
Closed on
Mar 14, 2003
Sold by
Lundgren Elizabeth C
Bought by
Shelley Carl D
Current Estimated Value
Home Financials for this Owner
Home Financials are based on the most recent Mortgage that was taken out on this home.
Original Mortgage
$220,000
Outstanding Balance
$94,992
Interest Rate
5.94%
Mortgage Type
Purchase Money Mortgage
Estimated Equity
$945,860
Create a Home Valuation Report for This Property
The Home Valuation Report is an in-depth analysis detailing your home's value as well as a comparison with similar homes in the area
Home Values in the Area
Average Home Value in this Area
Purchase History
| Date | Buyer | Sale Price | Title Company |
|---|---|---|---|
| Shelley Carl D | $275,000 | -- |
Source: Public Records
Mortgage History
| Date | Status | Borrower | Loan Amount |
|---|---|---|---|
| Open | Shelley Carl D | $220,000 |
Source: Public Records
Tax History Compared to Growth
Tax History
| Year | Tax Paid | Tax Assessment Tax Assessment Total Assessment is a certain percentage of the fair market value that is determined by local assessors to be the total taxable value of land and additions on the property. | Land | Improvement |
|---|---|---|---|---|
| 2025 | $4,755 | $1,098,100 | $500,900 | $597,200 |
| 2024 | $4,638 | $1,056,600 | $481,700 | $574,900 |
| 2023 | $4,282 | $916,900 | $394,100 | $522,800 |
| 2022 | $4,170 | $744,600 | $355,000 | $389,600 |
| 2021 | $4,003 | $663,900 | $348,000 | $315,900 |
| 2020 | $3,940 | $645,900 | $348,000 | $297,900 |
| 2019 | $3,765 | $610,200 | $341,200 | $269,000 |
| 2018 | $3,710 | $585,100 | $324,800 | $260,300 |
| 2017 | $3,598 | $585,100 | $324,800 | $260,300 |
| 2016 | $4,021 | $615,800 | $371,200 | $244,600 |
| 2015 | $3,941 | $615,800 | $371,200 | $244,600 |
| 2014 | $3,861 | $608,100 | $371,200 | $236,900 |
Source: Public Records
Map
Nearby Homes
- 262 Old Wharf Rd Unit 67
- 262 Old Wharf Rd Unit 5
- 262 Old Wharf Rd Unit 5
- 262 Old Wharf Rd Unit 20
- 262 Old Wharf Rd Unit 87
- 37 Beach Hills Rd
- 241 Old Wharf Rd Unit 82
- 241 Old Wharf Rd Unit 127
- 241 Old Wharf Rd Unit 90
- 37-A Beach Hills Rd
- 217 Old Wharf Rd Unit 64
- 22 Ferncliff Rd
- 154 Old Wharf Rd Unit 26
- 154 Old Wharf Rd Unit 14
- 102 Sea St
- 402 Old Wharf Rd
- 120 Old Wharf Rd Unit 11
- 402 Old Wharf Rd
- 64 Beaten Rd
- 31 Easy St
- 66 Oak St
- 66 Oak St Extension
- 7 Franklin Rd
- 70 Oak St
- 70 Oak St Extension
- 14 Franklin Rd
- 74 Oak St
- 74 Oak St Extension
- 60 Oak St
- 60 Oak St Extension
- 10 Franklin Rd
- 77 Oak St
- 77 Oak St Extension
- 81 Oak St
- 81 Oak St Extension
- 75 Oak St Extension
- 75 Oak St
- 2 Beach Hills Rd Unit 8
- 2 Beach St Unit 7
- 2 Beach St Unit 6