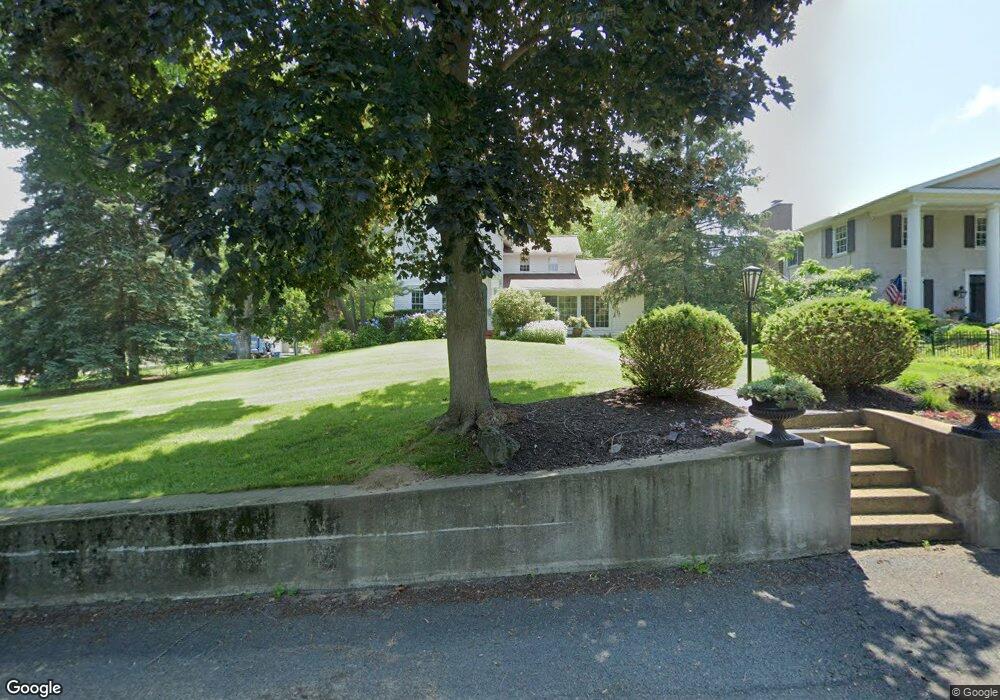
11 Fremont St Douglas, MI 49406
Estimated Value: $1,144,000 - $1,348,000
4
Beds
4
Baths
4,048
Sq Ft
$305/Sq Ft
Est. Value
About This Home
This home is located at 11 Fremont St, Douglas, MI 49406 and is currently estimated at $1,234,864, approximately $305 per square foot. 11 Fremont St is a home located in Allegan County with nearby schools including Douglas Elementary School, Saugatuck Middle School, and Saugatuck High School.
Ownership History
Date
Name
Owned For
Owner Type
Purchase Details
Closed on
Apr 20, 2017
Sold by
Goldberg David and Goldberg Mary Ann
Bought by
Goldberg David and Goldberg Mary Ann
Current Estimated Value
Purchase Details
Closed on
Dec 14, 2012
Sold by
Rippey Michael and Rippey Susan
Bought by
Goldberg David and Goldberg Mary Ann
Home Financials for this Owner
Home Financials are based on the most recent Mortgage that was taken out on this home.
Original Mortgage
$417,000
Outstanding Balance
$289,049
Interest Rate
3.38%
Mortgage Type
New Conventional
Estimated Equity
$945,815
Purchase Details
Closed on
Sep 9, 2009
Sold by
Keller Bonnie and Keller Bonnie L
Bought by
Rippey Michael and Rippey Susan
Home Financials for this Owner
Home Financials are based on the most recent Mortgage that was taken out on this home.
Original Mortgage
$410,000
Interest Rate
4.75%
Mortgage Type
New Conventional
Purchase Details
Closed on
Mar 14, 2003
Sold by
Strange Melissa P
Bought by
Keller Bonnie
Home Financials for this Owner
Home Financials are based on the most recent Mortgage that was taken out on this home.
Original Mortgage
$520,000
Interest Rate
4.87%
Mortgage Type
Purchase Money Mortgage
Create a Home Valuation Report for This Property
The Home Valuation Report is an in-depth analysis detailing your home's value as well as a comparison with similar homes in the area
Home Values in the Area
Average Home Value in this Area
Purchase History
| Date | Buyer | Sale Price | Title Company |
|---|---|---|---|
| Goldberg David | -- | Attorney | |
| Goldberg David | $550,000 | Premier Lakeshore Title Agen | |
| Rippey Michael | -- | None Available | |
| Keller Bonnie | $650,000 | Huntington Title Svcs Inc |
Source: Public Records
Mortgage History
| Date | Status | Borrower | Loan Amount |
|---|---|---|---|
| Open | Goldberg David | $417,000 | |
| Previous Owner | Rippey Michael | $410,000 | |
| Previous Owner | Keller Bonnie | $520,000 |
Source: Public Records
Tax History
| Year | Tax Paid | Tax Assessment Tax Assessment Total Assessment is a certain percentage of the fair market value that is determined by local assessors to be the total taxable value of land and additions on the property. | Land | Improvement |
|---|---|---|---|---|
| 2025 | $9,411 | $527,000 | $110,200 | $416,800 |
| 2024 | -- | $491,800 | $106,900 | $384,900 |
| 2023 | $8,838 | $404,200 | $90,000 | $314,200 |
| 2022 | $8,483 | $320,800 | $87,500 | $233,300 |
| 2021 | $13,330 | $305,700 | $87,500 | $218,200 |
| 2020 | $7,806 | $289,900 | $80,500 | $209,400 |
| 2019 | $0 | $262,400 | $80,500 | $181,900 |
| 2018 | $0 | $248,000 | $80,500 | $167,500 |
| 2017 | $0 | $242,900 | $80,500 | $162,400 |
| 2016 | $0 | $219,400 | $80,500 | $138,900 |
| 2015 | -- | $219,400 | $80,500 | $138,900 |
| 2014 | -- | $197,300 | $77,000 | $120,300 |
| 2013 | -- | $181,100 | $77,000 | $104,100 |
Source: Public Records
Map
Nearby Homes
- 89 S Washington St
- 43 Ellis St
- 11 E Chestnut St Unit 1
- 212 W Randolph St
- 160 Keewatin Way Unit D/9
- 295 Beachwood Way Unit 18
- 287 Beachwood Way Unit 19
- 311 Beachwood Way Unit 16
- 0 Washington St Unit Parcel 1.1 25037018
- 303 Beachwood Way Unit 17
- 50 Swing Bridge Ln
- 319 Beachwood Way Unit 15
- 134 Saint Peters Dr Unit 6
- 166 Saint Peters Dr Unit 2
- 150 Saint Peters Dr Unit 4
- 158 Saint Peters Dr Unit 3
- 142 Saint Peters Dr Unit 5
- 174 Saint Peters Dr Unit 1
- 342 Fremont St
- 327 Beachwood Way Unit 14
Your Personal Tour Guide
Ask me questions while you tour the home.