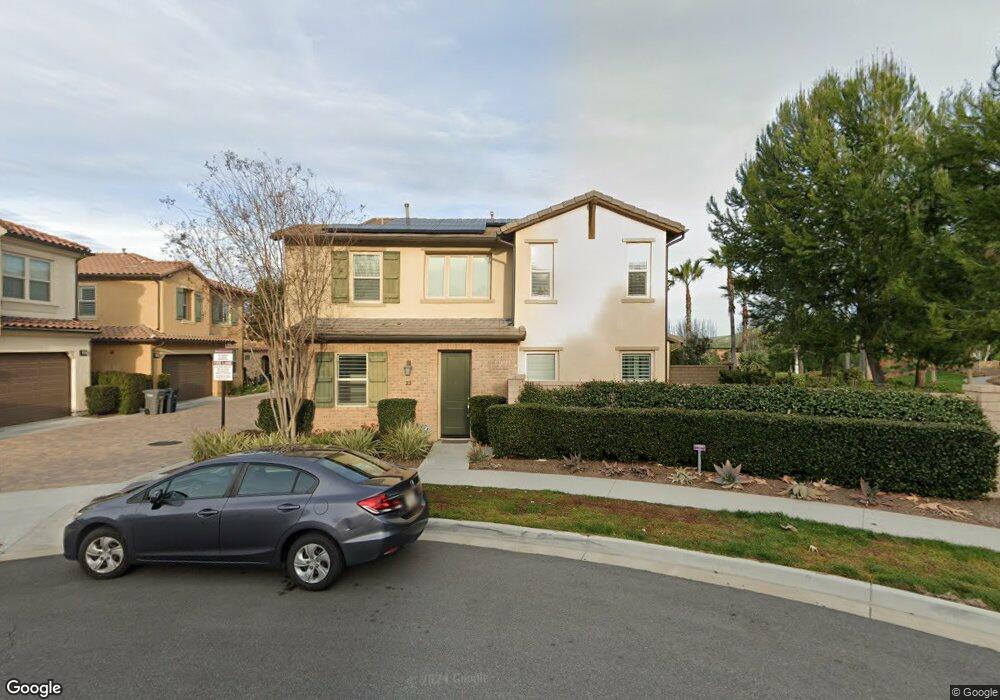
11 Fuchsia Lake Forest, CA 92630
Baker Ranch NeighborhoodEstimated Value: $1,303,435 - $1,425,000
3
Beds
3
Baths
1,693
Sq Ft
$815/Sq Ft
Est. Value
About This Home
This home is located at 11 Fuchsia, Lake Forest, CA 92630 and is currently estimated at $1,379,359, approximately $814 per square foot. 11 Fuchsia is a home with nearby schools including Foothill Ranch Elementary School, Serrano Intermediate School, and El Toro High School.
Ownership History
Date
Name
Owned For
Owner Type
Purchase Details
Closed on
May 19, 2016
Sold by
Mathur Bina
Bought by
Mathur Bina and Raj & Bina Mathur Revocable Trust
Current Estimated Value
Purchase Details
Closed on
Jan 14, 2016
Sold by
The Peake At Baker Ranch Phase 5
Bought by
Mathur Bina
Home Financials for this Owner
Home Financials are based on the most recent Mortgage that was taken out on this home.
Original Mortgage
$100,000
Outstanding Balance
$79,558
Interest Rate
3.97%
Mortgage Type
New Conventional
Estimated Equity
$1,299,801
Create a Home Valuation Report for This Property
The Home Valuation Report is an in-depth analysis detailing your home's value as well as a comparison with similar homes in the area
Home Values in the Area
Average Home Value in this Area
Purchase History
| Date | Buyer | Sale Price | Title Company |
|---|---|---|---|
| Mathur Bina | -- | None Available | |
| Mathur Bina | $806,000 | Fntg |
Source: Public Records
Mortgage History
| Date | Status | Borrower | Loan Amount |
|---|---|---|---|
| Open | Mathur Bina | $100,000 |
Source: Public Records
Tax History
| Year | Tax Paid | Tax Assessment Tax Assessment Total Assessment is a certain percentage of the fair market value that is determined by local assessors to be the total taxable value of land and additions on the property. | Land | Improvement |
|---|---|---|---|---|
| 2025 | $9,858 | $954,085 | $599,881 | $354,204 |
| 2024 | $9,858 | $935,378 | $588,119 | $347,259 |
| 2023 | $9,625 | $917,038 | $576,588 | $340,450 |
| 2022 | $9,452 | $899,057 | $565,282 | $333,775 |
| 2021 | $9,263 | $881,429 | $554,198 | $327,231 |
| 2020 | $9,179 | $872,392 | $548,516 | $323,876 |
| 2019 | $9,165 | $855,287 | $537,761 | $317,526 |
| 2018 | $8,992 | $838,517 | $527,217 | $311,300 |
| 2017 | $8,812 | $822,076 | $516,879 | $305,197 |
| 2016 | $5,738 | $549,462 | $247,790 | $301,672 |
Source: Public Records
Map
Nearby Homes
Your Personal Tour Guide
Ask me questions while you tour the home.