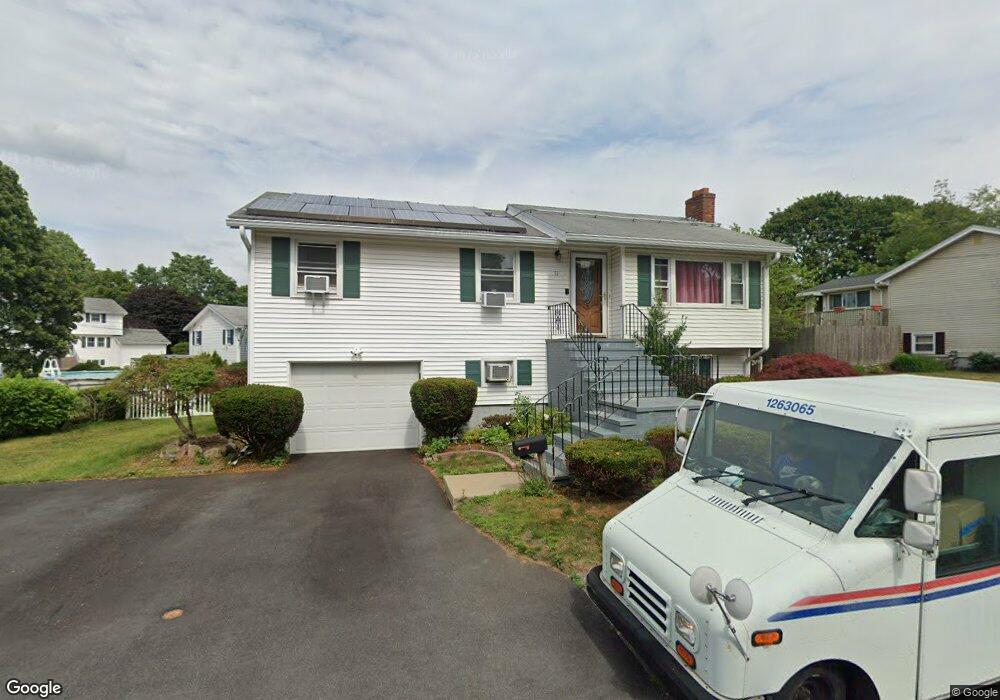
11 Gables Cir Salem, MA 01970
Witchcraft Heights NeighborhoodEstimated Value: $671,606 - $754,000
4
Beds
2
Baths
2,028
Sq Ft
$345/Sq Ft
Est. Value
About This Home
This home is located at 11 Gables Cir, Salem, MA 01970 and is currently estimated at $700,402, approximately $345 per square foot. 11 Gables Cir is a home located in Essex County with nearby schools including Witchcraft Heights Elementary School, Horace Mann Laboratory, and Bates Elementary School.
Ownership History
Date
Name
Owned For
Owner Type
Purchase Details
Closed on
Dec 9, 2020
Sold by
Aguilan Winifred
Bought by
Rizvi Julieta and Rizvi Syed R
Current Estimated Value
Home Financials for this Owner
Home Financials are based on the most recent Mortgage that was taken out on this home.
Original Mortgage
$382,500
Outstanding Balance
$341,146
Interest Rate
2.8%
Mortgage Type
New Conventional
Estimated Equity
$359,256
Purchase Details
Closed on
Aug 14, 2009
Sold by
Connelly John C and Connelly Kathryn M
Bought by
Aguilan Winifred
Home Financials for this Owner
Home Financials are based on the most recent Mortgage that was taken out on this home.
Original Mortgage
$283,500
Interest Rate
5.36%
Mortgage Type
Purchase Money Mortgage
Create a Home Valuation Report for This Property
The Home Valuation Report is an in-depth analysis detailing your home's value as well as a comparison with similar homes in the area
Home Values in the Area
Average Home Value in this Area
Purchase History
| Date | Buyer | Sale Price | Title Company |
|---|---|---|---|
| Rizvi Julieta | $450,000 | None Available | |
| Aguilan Winifred | $315,000 | -- |
Source: Public Records
Mortgage History
| Date | Status | Borrower | Loan Amount |
|---|---|---|---|
| Open | Rizvi Julieta | $382,500 | |
| Previous Owner | Aguilan Winifred | $272,650 | |
| Previous Owner | Aguilan Winifred | $283,500 | |
| Previous Owner | Aguilan Winifred | $110,000 | |
| Previous Owner | Aguilan Winifred | $150,000 |
Source: Public Records
Tax History Compared to Growth
Tax History
| Year | Tax Paid | Tax Assessment Tax Assessment Total Assessment is a certain percentage of the fair market value that is determined by local assessors to be the total taxable value of land and additions on the property. | Land | Improvement |
|---|---|---|---|---|
| 2025 | $6,949 | $612,800 | $225,200 | $387,600 |
| 2024 | $6,679 | $574,800 | $212,600 | $362,200 |
| 2023 | $6,505 | $520,000 | $193,500 | $326,500 |
| 2022 | $6,238 | $470,800 | $177,700 | $293,100 |
| 2021 | $5,946 | $430,900 | $165,000 | $265,900 |
| 2020 | $6,027 | $417,100 | $161,800 | $255,300 |
| 2019 | $6,004 | $397,600 | $152,300 | $245,300 |
| 2018 | $5,621 | $365,500 | $142,100 | $223,400 |
| 2017 | $5,389 | $339,800 | $133,200 | $206,600 |
| 2016 | $5,325 | $339,800 | $133,200 | $206,600 |
| 2015 | $4,910 | $299,200 | $117,400 | $181,800 |
Source: Public Records
Map
Nearby Homes
- 39 Gallows Hill Rd
- 36 Summit St
- 15 Wall St
- 46 Sutton St
- 38 Valley St
- 36 Valley St
- 2 Osborne St
- 176 Marlborough Rd
- 55 Butler St
- 9 Sutton St
- 159 Marlborough Rd
- 13 State St
- 145 Boston St
- 25 Outlook Ave
- 128 Boston St Unit 4
- 2 Hillside Ave
- 23 Proctor St
- 119 Highland Ave
- 10 Elliott Place Unit 1R
- 97 Mason St Unit 2