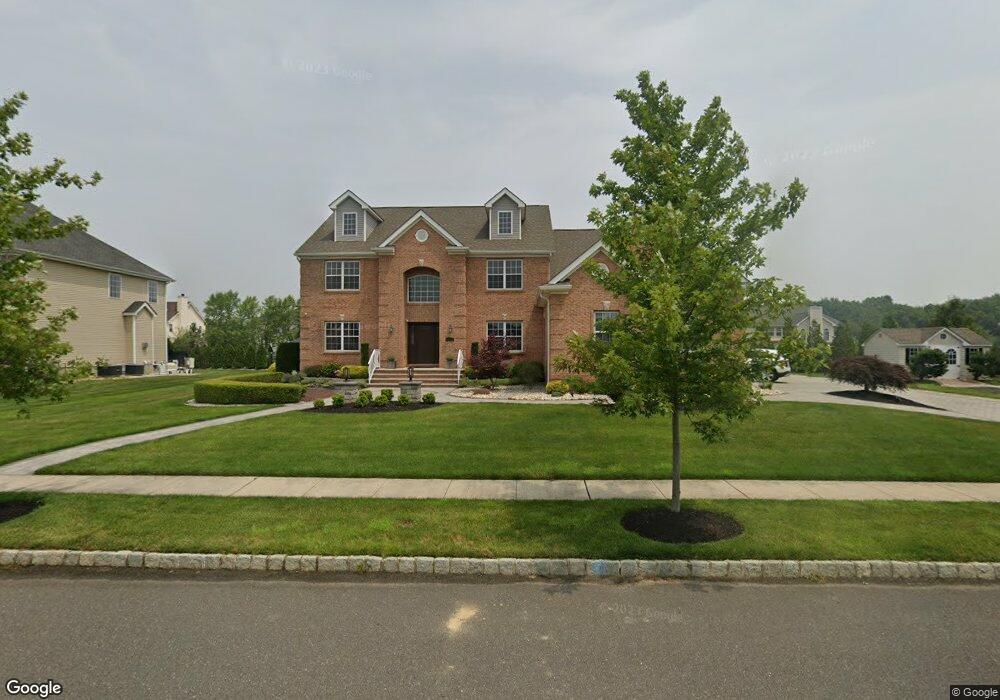
11 Garnet Ln Trenton, NJ 08691
Estimated Value: $1,345,792 - $1,521,000
5
Beds
5
Baths
6,830
Sq Ft
$215/Sq Ft
Est. Value
About This Home
This home is located at 11 Garnet Ln, Trenton, NJ 08691 and is currently estimated at $1,470,948, approximately $215 per square foot. 11 Garnet Ln is a home located in Mercer County with nearby schools including Sharon Elementary School, Pond Road Middle School, and Robbinsville High School.
Ownership History
Date
Name
Owned For
Owner Type
Purchase Details
Closed on
Aug 5, 2025
Sold by
Lim Steven and Lin Yi-Chun
Bought by
Jha Parag and Rawat Gunjan
Current Estimated Value
Home Financials for this Owner
Home Financials are based on the most recent Mortgage that was taken out on this home.
Original Mortgage
$1,050,000
Outstanding Balance
$1,049,082
Interest Rate
6.67%
Mortgage Type
New Conventional
Estimated Equity
$421,866
Purchase Details
Closed on
Dec 7, 2009
Sold by
Cubberly Meadows Llc
Bought by
Lim Steven and Lin Yi Chun
Create a Home Valuation Report for This Property
The Home Valuation Report is an in-depth analysis detailing your home's value as well as a comparison with similar homes in the area
Home Values in the Area
Average Home Value in this Area
Purchase History
| Date | Buyer | Sale Price | Title Company |
|---|---|---|---|
| Jha Parag | $1,499,999 | Trident Land Transfer | |
| Jha Parag | $1,499,999 | Trident Land Transfer | |
| Lim Steven | $639,795 | Vanguard Title Agency |
Source: Public Records
Mortgage History
| Date | Status | Borrower | Loan Amount |
|---|---|---|---|
| Open | Jha Parag | $1,050,000 | |
| Closed | Jha Parag | $1,050,000 |
Source: Public Records
Tax History Compared to Growth
Tax History
| Year | Tax Paid | Tax Assessment Tax Assessment Total Assessment is a certain percentage of the fair market value that is determined by local assessors to be the total taxable value of land and additions on the property. | Land | Improvement |
|---|---|---|---|---|
| 2025 | $20,644 | $617,700 | $167,200 | $450,500 |
| 2024 | $19,266 | $617,700 | $167,200 | $450,500 |
| 2023 | $19,266 | $617,700 | $167,200 | $450,500 |
| 2022 | $18,519 | $617,700 | $167,200 | $450,500 |
| 2021 | $18,253 | $617,700 | $167,200 | $450,500 |
| 2020 | $18,259 | $617,700 | $167,200 | $450,500 |
| 2019 | $18,265 | $617,700 | $167,200 | $450,500 |
| 2018 | $18,148 | $617,700 | $167,200 | $450,500 |
| 2017 | $18,111 | $617,700 | $167,200 | $450,500 |
| 2016 | $17,944 | $617,700 | $167,200 | $450,500 |
| 2015 | $17,672 | $594,200 | $167,200 | $427,000 |
| 2014 | $17,059 | $594,200 | $167,200 | $427,000 |
Source: Public Records
Map
Nearby Homes