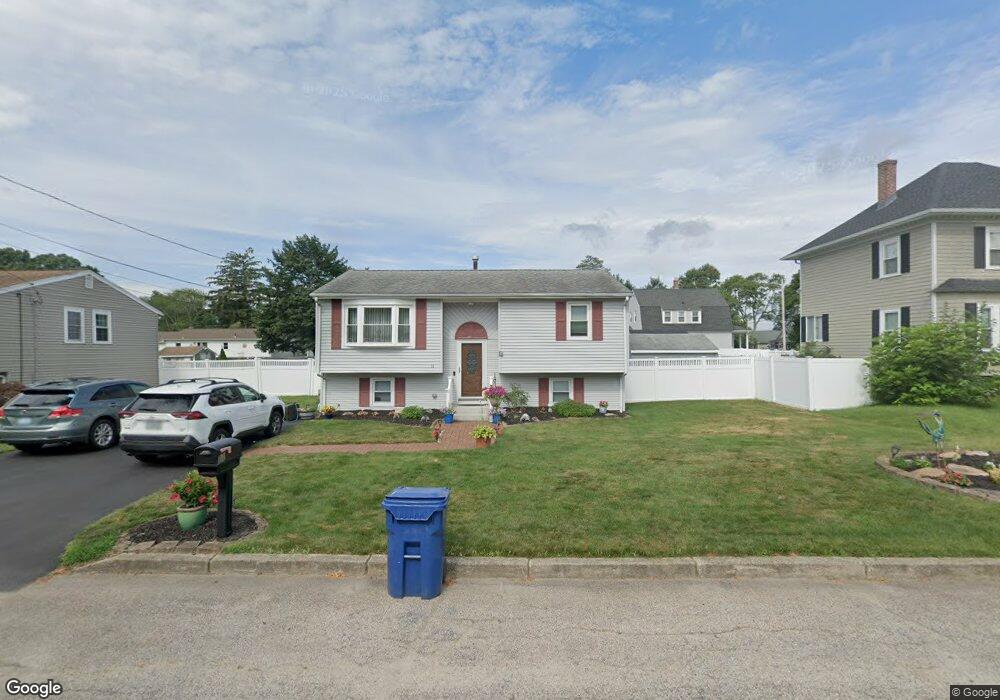
11 Gateway Ct Warwick, RI 02889
Hoxie NeighborhoodEstimated Value: $380,087 - $465,000
2
Beds
1
Bath
872
Sq Ft
$475/Sq Ft
Est. Value
About This Home
This home is located at 11 Gateway Ct, Warwick, RI 02889 and is currently estimated at $413,772, approximately $474 per square foot. 11 Gateway Ct is a home located in Kent County with nearby schools including Saint Kevin School and Bishop Hendricken High School.
Ownership History
Date
Name
Owned For
Owner Type
Purchase Details
Closed on
Oct 4, 2016
Sold by
Flynn Kathleen A
Bought by
Flynn Kathleen A
Current Estimated Value
Purchase Details
Closed on
May 29, 2015
Sold by
Conti Anthony L Jr Est and Flynn
Bought by
Flynn Kathleen A
Purchase Details
Closed on
Oct 4, 2010
Sold by
Conti Anthony L and Conti Kathleen A
Bought by
Conti Anthony L
Create a Home Valuation Report for This Property
The Home Valuation Report is an in-depth analysis detailing your home's value as well as a comparison with similar homes in the area
Home Values in the Area
Average Home Value in this Area
Purchase History
| Date | Buyer | Sale Price | Title Company |
|---|---|---|---|
| Flynn Kathleen A | -- | -- | |
| Flynn Kathleen A | -- | -- | |
| Conti Anthony L | -- | -- |
Source: Public Records
Mortgage History
| Date | Status | Borrower | Loan Amount |
|---|---|---|---|
| Previous Owner | Conti Anthony L | $55,000 |
Source: Public Records
Tax History
| Year | Tax Paid | Tax Assessment Tax Assessment Total Assessment is a certain percentage of the fair market value that is determined by local assessors to be the total taxable value of land and additions on the property. | Land | Improvement |
|---|---|---|---|---|
| 2025 | $4,431 | $348,900 | $107,500 | $241,400 |
| 2024 | $4,351 | $300,700 | $93,500 | $207,200 |
| 2023 | $4,267 | $300,700 | $93,500 | $207,200 |
| 2022 | $4,173 | $222,800 | $66,200 | $156,600 |
| 2021 | $4,173 | $222,800 | $66,200 | $156,600 |
| 2020 | $4,173 | $222,800 | $66,200 | $156,600 |
| 2019 | $4,173 | $222,800 | $66,200 | $156,600 |
| 2018 | $3,704 | $178,100 | $66,200 | $111,900 |
| 2017 | $3,605 | $178,100 | $66,200 | $111,900 |
| 2016 | $3,605 | $178,100 | $66,200 | $111,900 |
| 2015 | $3,243 | $156,300 | $59,100 | $97,200 |
| 2014 | -- | $156,300 | $59,100 | $97,200 |
| 2013 | $3,093 | $156,300 | $59,100 | $97,200 |
Source: Public Records
Map
Nearby Homes
- 55 Dixie Ave
- 72 W Shore Rd Unit 3
- 33 Recess Ln
- 49 Recess Ln
- 14 Recess Ln
- 80 Twin Oak Dr
- 21 Sarah Ln
- 44 Woodstock Dr
- 52 Dahlia St
- 108 Fern St
- 20 Commodore Ave
- 63 Ramblewood Dr
- 0 Bethel St
- 31 Archdale Dr
- 48 Rowe Ave
- 39 Holiday Ave
- 54 Ansonia Rd
- 15 Christopher Rhodes Way
- 6 Christopher Rhodes Way
- 101 Farmland Rd
Your Personal Tour Guide
Ask me questions while you tour the home.