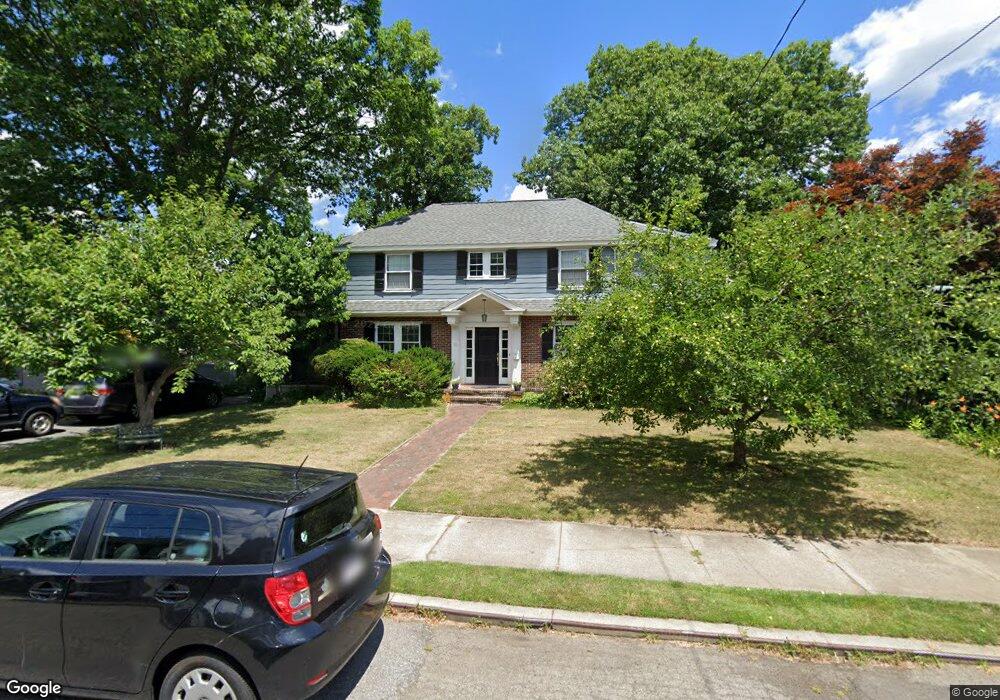
11 George St Newton, MA 02458
Newton Corner NeighborhoodEstimated Value: $1,674,608 - $2,014,000
4
Beds
3
Baths
2,200
Sq Ft
$838/Sq Ft
Est. Value
About This Home
This home is located at 11 George St, Newton, MA 02458 and is currently estimated at $1,843,652, approximately $838 per square foot. 11 George St is a home located in Middlesex County with nearby schools including Underwood Elementary School, Bigelow Middle School, and Newton North High School.
Ownership History
Date
Name
Owned For
Owner Type
Purchase Details
Closed on
Jun 1, 2022
Sold by
Simpson Douglas S and Simpson Joanne C
Bought by
Simpson Ft
Current Estimated Value
Purchase Details
Closed on
Dec 29, 2005
Sold by
Li Weishi and Meng Xun
Bought by
Simpson Douglas S and Simpson Joanne C
Home Financials for this Owner
Home Financials are based on the most recent Mortgage that was taken out on this home.
Original Mortgage
$310,000
Interest Rate
6.39%
Mortgage Type
Purchase Money Mortgage
Purchase Details
Closed on
Apr 23, 2003
Sold by
Hight Eleanor M and Huf Thomas P
Bought by
Li Weishi and Meng Xun
Home Financials for this Owner
Home Financials are based on the most recent Mortgage that was taken out on this home.
Original Mortgage
$569,600
Interest Rate
5.64%
Mortgage Type
Purchase Money Mortgage
Purchase Details
Closed on
Jan 3, 1997
Sold by
Marks Nt and Marks Elden E
Bought by
Hight Eleanor M and Huf Thomas P
Create a Home Valuation Report for This Property
The Home Valuation Report is an in-depth analysis detailing your home's value as well as a comparison with similar homes in the area
Home Values in the Area
Average Home Value in this Area
Purchase History
| Date | Buyer | Sale Price | Title Company |
|---|---|---|---|
| Simpson Ft | -- | None Available | |
| Simpson Douglas S | $765,000 | -- | |
| Li Weishi | $712,000 | -- | |
| Hight Eleanor M | $409,000 | -- |
Source: Public Records
Mortgage History
| Date | Status | Borrower | Loan Amount |
|---|---|---|---|
| Previous Owner | Hight Eleanor M | $90,000 | |
| Previous Owner | Simpson Douglas S | $310,000 | |
| Previous Owner | Li Weishi | $569,600 | |
| Previous Owner | Hight Eleanor M | $60,000 |
Source: Public Records
Tax History Compared to Growth
Tax History
| Year | Tax Paid | Tax Assessment Tax Assessment Total Assessment is a certain percentage of the fair market value that is determined by local assessors to be the total taxable value of land and additions on the property. | Land | Improvement |
|---|---|---|---|---|
| 2025 | $12,979 | $1,324,400 | $1,048,300 | $276,100 |
| 2024 | $12,549 | $1,285,800 | $1,017,800 | $268,000 |
| 2023 | $11,985 | $1,177,300 | $781,100 | $396,200 |
| 2022 | $11,468 | $1,090,100 | $723,200 | $366,900 |
| 2021 | $11,066 | $1,028,400 | $682,300 | $346,100 |
| 2020 | $10,736 | $1,028,400 | $682,300 | $346,100 |
| 2019 | $10,433 | $998,400 | $662,400 | $336,000 |
| 2018 | $10,032 | $927,200 | $599,300 | $327,900 |
| 2017 | $9,727 | $874,700 | $565,400 | $309,300 |
| 2016 | $9,303 | $817,500 | $528,400 | $289,100 |
| 2015 | $8,562 | $737,500 | $493,800 | $243,700 |
Source: Public Records
Map
Nearby Homes
- 59 Hyde Ave
- 35 George St Unit 35
- 37 George St Unit 37
- 655 Centre St
- 206 Franklin St
- 327 Franklin St
- 543 Centre St Unit 6
- 548 Centre St Unit 5
- 28 Laudholm Rd
- 8 Hollis St
- 14 Summit St Unit 14-F
- 14 Princeton St Unit 14
- 14 Princeton St
- 65 Shornecliffe Rd
- 34 Winchester Rd Unit 34
- 22 Holland St Unit 22
- 106 Farlow Rd
- 12 Richardson St Unit 14
- 31 W Boulevard Rd
- 96 E Side Pkwy
- 19 George St
- 12 Garden Rd
- 16 Garden Rd
- 4 George St
- 12 George St
- 27 George St
- 16 George St
- 22 George St Unit 24
- 22 George St Unit 1
- 22 George St Unit 22
- 24 George St Unit 22
- 24 George St Unit 2
- 22 George St Unit 22-1
- 24 George St Unit 24
- 22-24 George St
- 24 Garden Rd
- 85 Hyde Ave
- 85 Hyde Ave Unit B
- 28 George St
- 26 George St