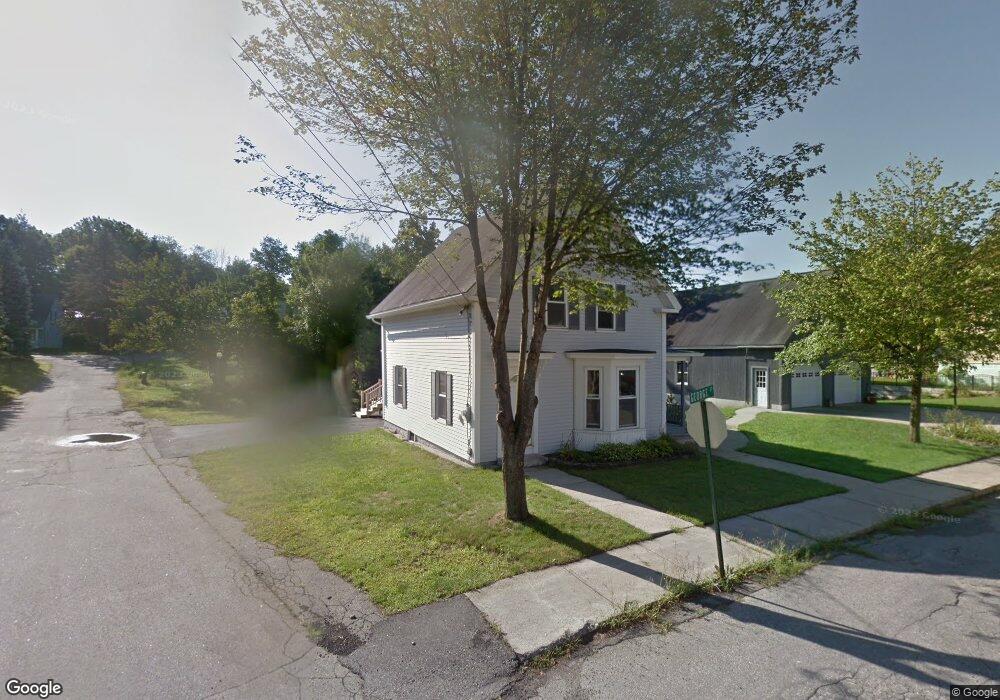
11 George St Springvale, ME 04083
Estimated Value: $322,000 - $354,407
4
Beds
2
Baths
1,538
Sq Ft
$219/Sq Ft
Est. Value
About This Home
This home is located at 11 George St, Springvale, ME 04083 and is currently estimated at $336,852, approximately $219 per square foot. 11 George St is a home located in York County with nearby schools including St Thomas Consolidated School and Sanford Christian Academy.
Ownership History
Date
Name
Owned For
Owner Type
Purchase Details
Closed on
Jun 17, 2015
Sold by
Plante Kyle W and Moody Danielle M
Bought by
Hudson Tyler E and Hudson Erica W
Current Estimated Value
Home Financials for this Owner
Home Financials are based on the most recent Mortgage that was taken out on this home.
Original Mortgage
$140,000
Interest Rate
3.78%
Mortgage Type
New Conventional
Purchase Details
Closed on
Feb 15, 2013
Sold by
C A Plante & Sons Inc
Bought by
Moody Danielle M and Plante Kyle W
Home Financials for this Owner
Home Financials are based on the most recent Mortgage that was taken out on this home.
Original Mortgage
$120,000
Interest Rate
3.38%
Mortgage Type
New Conventional
Purchase Details
Closed on
Jun 27, 2011
Sold by
Salem Five Cents Sav Bank
Bought by
C A Plante & Sons Inc
Home Financials for this Owner
Home Financials are based on the most recent Mortgage that was taken out on this home.
Original Mortgage
$120,000
Interest Rate
4.63%
Mortgage Type
Purchase Money Mortgage
Create a Home Valuation Report for This Property
The Home Valuation Report is an in-depth analysis detailing your home's value as well as a comparison with similar homes in the area
Home Values in the Area
Average Home Value in this Area
Purchase History
| Date | Buyer | Sale Price | Title Company |
|---|---|---|---|
| Hudson Tyler E | -- | -- | |
| Moody Danielle M | -- | -- | |
| Moody Danielle M | -- | -- | |
| C A Plante & Sons Inc | -- | -- | |
| C A Plante & Sons Inc | -- | -- |
Source: Public Records
Mortgage History
| Date | Status | Borrower | Loan Amount |
|---|---|---|---|
| Closed | Hudson Tyler E | $140,000 | |
| Previous Owner | Moody Danielle M | $120,000 | |
| Previous Owner | C A Plante & Sons Inc | $120,000 | |
| Previous Owner | C A Plante & Sons Inc | $176,000 |
Source: Public Records
Tax History
| Year | Tax Paid | Tax Assessment Tax Assessment Total Assessment is a certain percentage of the fair market value that is determined by local assessors to be the total taxable value of land and additions on the property. | Land | Improvement |
|---|---|---|---|---|
| 2025 | $4,670 | $273,100 | $44,700 | $228,400 |
| 2024 | $4,408 | $273,100 | $44,700 | $228,400 |
| 2023 | $4,104 | $271,100 | $44,700 | $226,400 |
| 2022 | $4,012 | $271,100 | $44,700 | $226,400 |
| 2021 | $4,023 | $221,300 | $44,700 | $176,600 |
| 2020 | $4,111 | $203,900 | $44,700 | $159,200 |
| 2019 | $3,809 | $184,000 | $44,700 | $139,300 |
| 2018 | $3,678 | $179,400 | $44,700 | $134,700 |
| 2017 | $3,574 | $172,300 | $44,700 | $127,600 |
| 2016 | $3,536 | $155,500 | $44,700 | $110,800 |
| 2015 | $3,434 | $155,800 | $49,500 | $106,300 |
| 2014 | $3,373 | $156,000 | $49,500 | $106,500 |
| 2013 | -- | $156,500 | $49,500 | $107,000 |
Source: Public Records
Map
Nearby Homes
Your Personal Tour Guide
Ask me questions while you tour the home.