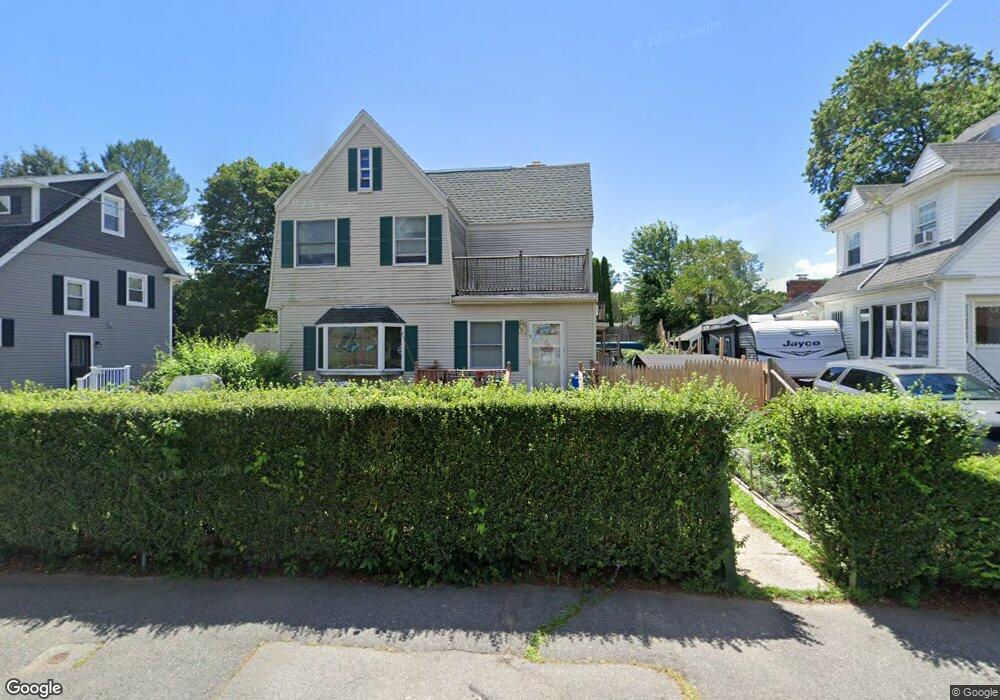
11 Glidden St Beverly, MA 01915
North Beverly NeighborhoodEstimated Value: $700,000 - $795,000
3
Beds
2
Baths
1,755
Sq Ft
$425/Sq Ft
Est. Value
About This Home
This home is located at 11 Glidden St, Beverly, MA 01915 and is currently estimated at $746,611, approximately $425 per square foot. 11 Glidden St is a home located in Essex County with nearby schools including Beverly High School, The Saints Academy, and Shore Country Day School.
Ownership History
Date
Name
Owned For
Owner Type
Purchase Details
Closed on
May 14, 1993
Sold by
William Quigley Jr Est and Quigley
Bought by
Carnevale Laura L
Current Estimated Value
Home Financials for this Owner
Home Financials are based on the most recent Mortgage that was taken out on this home.
Original Mortgage
$64,000
Interest Rate
7.47%
Mortgage Type
Purchase Money Mortgage
Create a Home Valuation Report for This Property
The Home Valuation Report is an in-depth analysis detailing your home's value as well as a comparison with similar homes in the area
Home Values in the Area
Average Home Value in this Area
Purchase History
| Date | Buyer | Sale Price | Title Company |
|---|---|---|---|
| Carnevale Laura L | $80,000 | -- |
Source: Public Records
Mortgage History
| Date | Status | Borrower | Loan Amount |
|---|---|---|---|
| Open | Carnevale Laura L | $16,000 | |
| Closed | Carnevale Laura L | $10,000 | |
| Closed | Carnevale Laura L | $10,000 | |
| Closed | Carnevale Laura L | $64,000 |
Source: Public Records
Tax History
| Year | Tax Paid | Tax Assessment Tax Assessment Total Assessment is a certain percentage of the fair market value that is determined by local assessors to be the total taxable value of land and additions on the property. | Land | Improvement |
|---|---|---|---|---|
| 2025 | $7,011 | $637,900 | $365,000 | $272,900 |
| 2024 | $6,745 | $600,600 | $327,700 | $272,900 |
| 2023 | $6,512 | $578,300 | $305,400 | $272,900 |
| 2022 | $6,381 | $524,300 | $251,400 | $272,900 |
| 2021 | $5,937 | $467,500 | $221,600 | $245,900 |
| 2020 | $5,782 | $450,700 | $204,800 | $245,900 |
| 2019 | $5,660 | $428,500 | $189,900 | $238,600 |
| 2018 | $5,497 | $404,200 | $186,200 | $218,000 |
| 2017 | $5,188 | $363,300 | $145,200 | $218,100 |
| 2016 | $5,068 | $352,200 | $134,100 | $218,100 |
| 2015 | $4,970 | $352,200 | $134,100 | $218,100 |
Source: Public Records
Map
Nearby Homes
- 50 Balch St Unit 300
- 50 Balch St Unit 200
- 50 Balch St Unit 205
- 50 Balch St Unit 308
- 50 Balch St Unit 511
- 50 Balch St Unit 209
- 50 Balch St Unit 409
- 50 Balch St Unit 316
- 50 Balch St Unit 315
- 50 Balch St Unit 103
- 50 Balch St Unit 412
- 50 Balch St Unit 112
- 9 Swan St Unit 2
- 6 Charles St
- 13 Giles Ave Unit 2
- 4 Duck Pond Rd Unit 225
- 61 Ellsworth Ave
- 348 Rantoul St Unit 202
- 40 Heather St Unit 204
- 34 Chase St
Your Personal Tour Guide
Ask me questions while you tour the home.