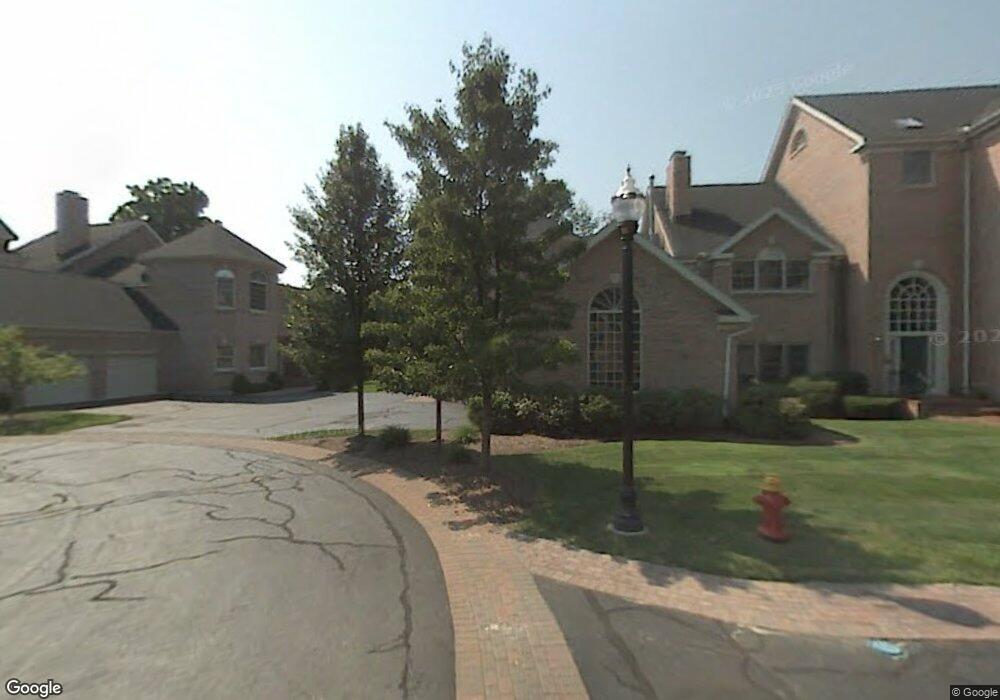
11 Governors Row Unit 11 West Hartford, CT 06117
Estimated Value: $562,000 - $666,000
4
Beds
4
Baths
3,820
Sq Ft
$158/Sq Ft
Est. Value
About This Home
This home is located at 11 Governors Row Unit 11, West Hartford, CT 06117 and is currently estimated at $604,558, approximately $158 per square foot. 11 Governors Row Unit 11 is a home located in Hartford County with nearby schools including Norfeldt School, King Philip Middle School, and Hall High School.
Ownership History
Date
Name
Owned For
Owner Type
Purchase Details
Closed on
Jul 8, 2008
Sold by
Glennon Lauren
Bought by
Benanav Ruth T and Benanav Gary G
Current Estimated Value
Purchase Details
Closed on
Jul 26, 2007
Sold by
Ratner Laurence
Bought by
Glennon Lauren
Home Financials for this Owner
Home Financials are based on the most recent Mortgage that was taken out on this home.
Original Mortgage
$180,000
Interest Rate
6.24%
Purchase Details
Closed on
Oct 4, 2004
Sold by
Youmans Andrew Lee
Bought by
Ratner Laurence
Home Financials for this Owner
Home Financials are based on the most recent Mortgage that was taken out on this home.
Original Mortgage
$440,000
Interest Rate
5.81%
Purchase Details
Closed on
Sep 20, 2002
Sold by
Laden Linda G
Bought by
Russell Rorie L and Russell Barton D
Purchase Details
Closed on
Jul 11, 1997
Sold by
Wilkins James D and Wilkins Sara A
Bought by
Laden Steven P and Laden Linda G
Purchase Details
Closed on
May 2, 1996
Sold by
Dellavecchia Eugene and Dellavecchia Judith
Bought by
Wilkins James and Wilkins Sara
Purchase Details
Closed on
May 18, 1995
Sold by
Fgb Rlty Advisors Inc
Bought by
Bilansky Lawrence
Purchase Details
Closed on
May 17, 1989
Sold by
Whiting Estates Inc
Bought by
Dellaveechia Eugene
Create a Home Valuation Report for This Property
The Home Valuation Report is an in-depth analysis detailing your home's value as well as a comparison with similar homes in the area
Home Values in the Area
Average Home Value in this Area
Purchase History
| Date | Buyer | Sale Price | Title Company |
|---|---|---|---|
| Benanav Ruth T | $690,000 | -- | |
| Glennon Lauren | $725,000 | -- | |
| Ratner Laurence | $550,000 | -- | |
| Russell Rorie L | $455,000 | -- | |
| Laden Steven P | $362,000 | -- | |
| Wilkins James | $395,000 | -- | |
| Bilansky Lawrence | $48,000 | -- | |
| Dellaveechia Eugene | $595,000 | -- |
Source: Public Records
Mortgage History
| Date | Status | Borrower | Loan Amount |
|---|---|---|---|
| Previous Owner | Dellaveechia Eugene | $180,000 | |
| Previous Owner | Dellaveechia Eugene | $440,000 |
Source: Public Records
Tax History Compared to Growth
Tax History
| Year | Tax Paid | Tax Assessment Tax Assessment Total Assessment is a certain percentage of the fair market value that is determined by local assessors to be the total taxable value of land and additions on the property. | Land | Improvement |
|---|---|---|---|---|
| 2025 | $12,473 | $278,530 | $0 | $278,530 |
| 2024 | $11,796 | $278,530 | $0 | $278,530 |
| 2023 | $11,397 | $278,530 | $0 | $278,530 |
| 2022 | $11,331 | $278,530 | $0 | $278,530 |
| 2021 | $13,333 | $314,300 | $0 | $314,300 |
| 2020 | $13,161 | $314,860 | $0 | $314,860 |
| 2019 | $13,161 | $314,860 | $0 | $314,860 |
| 2018 | $12,909 | $314,860 | $0 | $314,860 |
| 2017 | $12,922 | $314,860 | $0 | $314,860 |
| 2016 | $13,997 | $354,270 | $0 | $354,270 |
| 2015 | $13,572 | $354,270 | $0 | $354,270 |
| 2014 | $13,239 | $354,270 | $0 | $354,270 |
Source: Public Records
Map
Nearby Homes
- 592 Mountain Rd Unit A
- 10 Hosmer Dr
- 21 Barksdale Rd
- 11 Rye Ridge Pkwy
- 75 Arlen Way
- 40 Ferncliff Dr
- 50 Magnolia Hill
- 36 Richmond Ln
- 2581 Albany Ave
- 47 Flagg Rd
- 10 Ironwood Ln
- 124 High Ridge Rd
- 30 Farmstead Ln
- 62 Blue Ridge Ln
- 16 Morningcrest Dr
- 21 Rushleigh Rd
- 17 Cranbrook
- 15 Rushleigh Rd
- 56 Fox Chase Ln
- 25 Lakeview Dr
- 8 Governors Row
- 6 Governors Row
- 4 Governors Row
- 34 Governors Row
- 32 Governors Row
- 14 Governors Row
- 12 Governors Row
- 9 Governors Row
- 7 Governors Row
- 5 Governors Row
- 11 Governors Row
- 5 Governors Row Unit 5
- 14 Governors Row Unit 14
- 34 Governors Row
- 7 Governors Row Unit 7
- 34 Governors Row Unit 34
- 1 Governors Row
- 22 Governors Row
- 22 Governors Row Unit 22
- 20 Governors Row