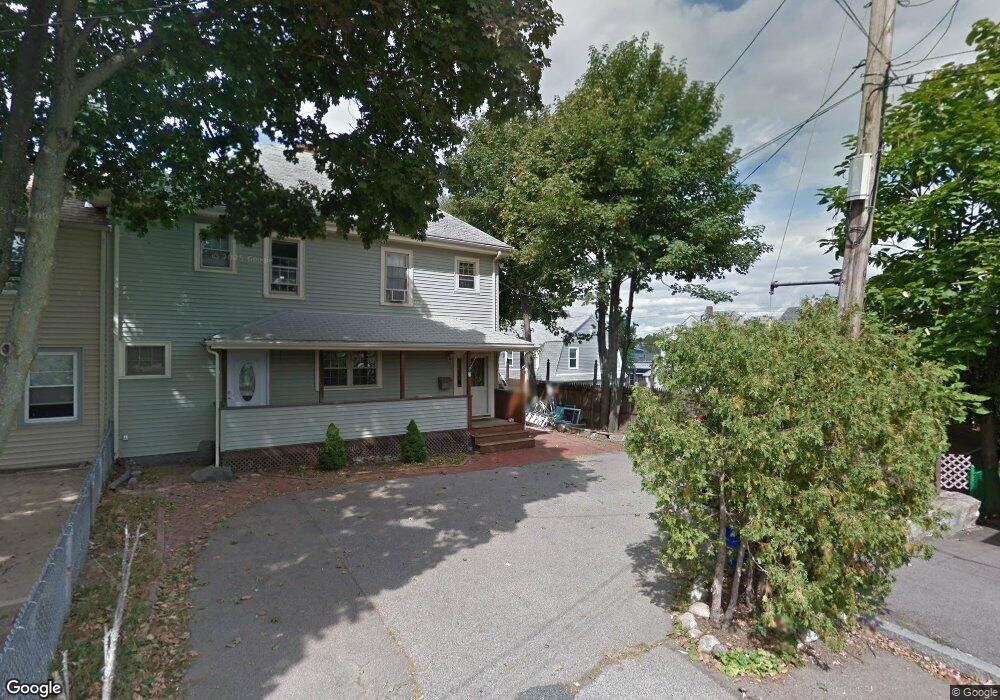
11 Grant Place Quincy, MA 02169
Quincy Point NeighborhoodEstimated Value: $734,000 - $892,000
4
Beds
2
Baths
1,509
Sq Ft
$544/Sq Ft
Est. Value
About This Home
This home is located at 11 Grant Place, Quincy, MA 02169 and is currently estimated at $821,188, approximately $544 per square foot. 11 Grant Place is a home located in Norfolk County with nearby schools including Point Webster Middle School, Clifford H. Marshall Elementary School, and Quincy High School.
Ownership History
Date
Name
Owned For
Owner Type
Purchase Details
Closed on
Jan 9, 1998
Sold by
Marquis Edward F and Marquis Roseanna
Bought by
Brown Thomas P and Brown Joanne
Current Estimated Value
Home Financials for this Owner
Home Financials are based on the most recent Mortgage that was taken out on this home.
Original Mortgage
$150,250
Interest Rate
7.09%
Mortgage Type
Purchase Money Mortgage
Create a Home Valuation Report for This Property
The Home Valuation Report is an in-depth analysis detailing your home's value as well as a comparison with similar homes in the area
Home Values in the Area
Average Home Value in this Area
Purchase History
| Date | Buyer | Sale Price | Title Company |
|---|---|---|---|
| Brown Thomas P | $154,900 | -- |
Source: Public Records
Mortgage History
| Date | Status | Borrower | Loan Amount |
|---|---|---|---|
| Open | Brown Thomas P | $145,000 | |
| Closed | Brown Thomas P | $150,250 |
Source: Public Records
Tax History
| Year | Tax Paid | Tax Assessment Tax Assessment Total Assessment is a certain percentage of the fair market value that is determined by local assessors to be the total taxable value of land and additions on the property. | Land | Improvement |
|---|---|---|---|---|
| 2025 | $8,270 | $717,300 | $244,400 | $472,900 |
| 2024 | $7,761 | $688,600 | $232,700 | $455,900 |
| 2023 | $7,428 | $667,400 | $211,500 | $455,900 |
| 2022 | $7,196 | $600,700 | $192,300 | $408,400 |
| 2021 | $6,558 | $540,200 | $192,300 | $347,900 |
| 2020 | $5,334 | $429,100 | $181,400 | $247,700 |
| 2019 | $4,967 | $395,800 | $168,000 | $227,800 |
| 2018 | $5,053 | $378,800 | $152,700 | $226,100 |
| 2017 | $4,737 | $334,300 | $145,400 | $188,900 |
| 2016 | $4,452 | $310,000 | $132,200 | $177,800 |
| 2015 | $4,399 | $301,300 | $124,700 | $176,600 |
| 2014 | $3,936 | $264,900 | $124,700 | $140,200 |
Source: Public Records
Map
Nearby Homes
- 5 Main St
- 72 Main St
- 35 Miller Stile Rd
- 66 Mcgrath Hwy Unit 302
- 66 Mcgrath Hwy Unit 402
- 66 Mcgrath Hwy Unit 309
- 66 Mcgrath Hwy Unit 201
- 51 Sumner St
- 101 Sumner St Unit B
- 59 Spear St Unit 201
- 59 Spear St Unit 302
- 59 Spear St Unit 402
- 59 Spear St Unit 202
- 59 Spear St Unit 301
- 44 Elm St
- 161 Sumner St Unit 2
- 33 Elm St
- 388 Washington St Unit 302
- 388 Washington St Unit 301
- 388 Washington St Unit 205
- 11 Grant Place Unit 1
- 13 Grant Place Unit 2
- 83 Union St
- 10 Grant Place
- 6 Lancaster St
- 79 Union St
- 79 Union St Unit L
- 245 Washington St
- 241 Washington St
- 81 Union St Unit 81
- 12 Lancaster St
- 12 Lancaster St
- 12 Lancaster St Unit 1
- 12 Lancaster St
- 12 Lancaster St Unit 2
- 75 Union St
- 63 Union St
- 249 Washington St Unit 2, 3
- 249 Washington St Unit 1, 2, 3
- 249 Washington St
Your Personal Tour Guide
Ask me questions while you tour the home.