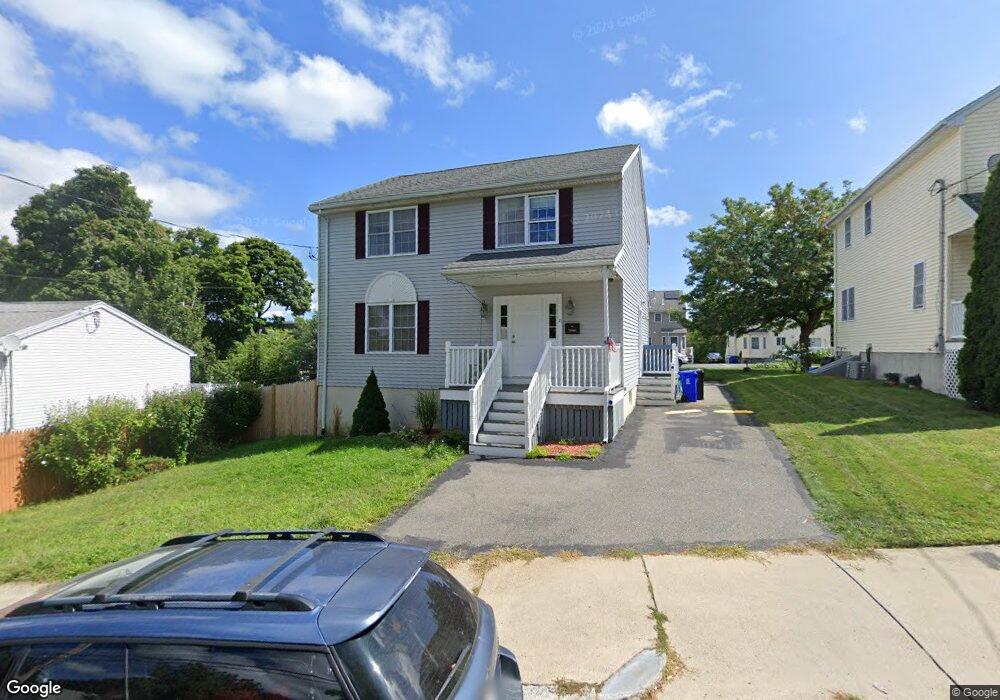
11 Grape St Malden, MA 02148
Suffolk Square NeighborhoodEstimated Value: $757,000 - $854,851
3
Beds
3
Baths
1,680
Sq Ft
$478/Sq Ft
Est. Value
About This Home
This home is located at 11 Grape St, Malden, MA 02148 and is currently estimated at $802,713, approximately $477 per square foot. 11 Grape St is a home located in Middlesex County with nearby schools including Malden High School, Cheverus Catholic School, and Malden Catholic.
Ownership History
Date
Name
Owned For
Owner Type
Purchase Details
Closed on
Dec 16, 2005
Sold by
Bo-Jac Constr Corp
Bought by
Layne Ann M and Layne Cameron
Current Estimated Value
Home Financials for this Owner
Home Financials are based on the most recent Mortgage that was taken out on this home.
Original Mortgage
$275,000
Outstanding Balance
$154,321
Interest Rate
6.34%
Mortgage Type
Purchase Money Mortgage
Estimated Equity
$648,392
Purchase Details
Closed on
Jul 2, 2004
Sold by
Malden City Of
Bought by
Malden Redevelopment A
Create a Home Valuation Report for This Property
The Home Valuation Report is an in-depth analysis detailing your home's value as well as a comparison with similar homes in the area
Home Values in the Area
Average Home Value in this Area
Purchase History
| Date | Buyer | Sale Price | Title Company |
|---|---|---|---|
| Layne Ann M | $475,000 | -- | |
| Malden Redevelopment A | -- | -- |
Source: Public Records
Mortgage History
| Date | Status | Borrower | Loan Amount |
|---|---|---|---|
| Open | Layne Ann M | $275,000 |
Source: Public Records
Tax History Compared to Growth
Tax History
| Year | Tax Paid | Tax Assessment Tax Assessment Total Assessment is a certain percentage of the fair market value that is determined by local assessors to be the total taxable value of land and additions on the property. | Land | Improvement |
|---|---|---|---|---|
| 2025 | $86 | $761,900 | $310,600 | $451,300 |
| 2024 | $8,277 | $708,000 | $293,300 | $414,700 |
| 2023 | $8,008 | $656,900 | $267,500 | $389,400 |
| 2022 | $7,667 | $620,800 | $241,600 | $379,200 |
| 2021 | $7,160 | $582,600 | $215,700 | $366,900 |
| 2020 | $7,171 | $566,900 | $208,400 | $358,500 |
| 2019 | $6,701 | $505,000 | $198,400 | $306,600 |
| 2018 | $6,456 | $458,200 | $163,900 | $294,300 |
| 2017 | $6,286 | $443,600 | $157,500 | $286,100 |
| 2016 | $6,138 | $404,900 | $144,500 | $260,400 |
| 2015 | $6,130 | $389,700 | $137,600 | $252,100 |
| 2014 | $5,802 | $360,400 | $125,100 | $235,300 |
Source: Public Records
Map
Nearby Homes
- 272-274 Cross St Unit 1
- 272-274 Cross St Unit 4
- 272-274 Cross St Unit 3
- 272-274 Cross St Unit 5
- 272-274 Cross St Unit 2
- 40-42 Upham St Unit 1
- 10 Linwood St Unit 214
- 13-15 Benner Ave
- 16 Boylston St
- 30 Franklin St Unit 105
- 45 Richardson St
- 17 Ashton St
- 17 Garland Ave
- 42 Auburn St
- 58 Clark St
- 48 Tremont St
- 37-39 Park St
- 43 Park St
- 241 Mountain Ave
- 89 Judson St
- 7 Grape St
- 99 Upham St
- 16- Grape St
- 164 Franklin St
- 91 Upham St
- 15 Grape St
- 340 Cross St
- 328 Cross St
- 158 Franklin St
- 158 Franklin St Unit 1
- 344 Cross St
- 320 Cross St
- 16 Grape St
- 16 Grape St Unit 1
- 161 Franklin St Unit 161
- 12 Grape St
- 87 Upham St
- 154 Franklin St Unit 156A
- 157 Franklin St Unit 7
- 312 Cross St