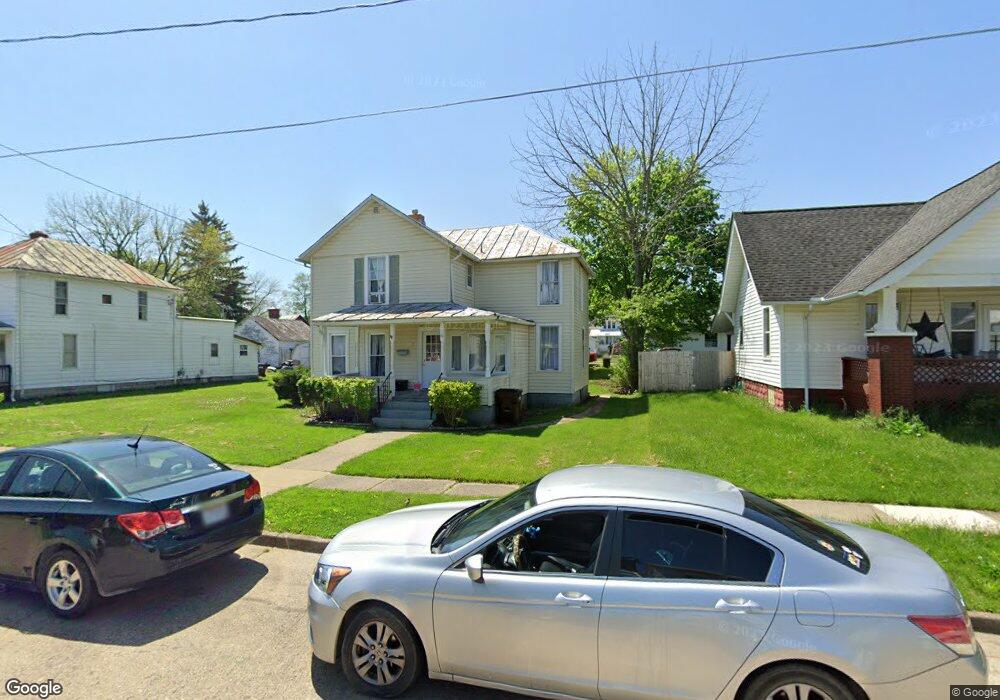
11 Greer St Mount Vernon, OH 43050
Estimated Value: $202,095 - $258,000
3
Beds
1
Bath
1,616
Sq Ft
$144/Sq Ft
Est. Value
About This Home
This home is located at 11 Greer St, Mount Vernon, OH 43050 and is currently estimated at $233,274, approximately $144 per square foot. 11 Greer St is a home located in Knox County with nearby schools including Mount Vernon High School, St. Vincent de Paul School, and Christian Star Academy.
Ownership History
Date
Name
Owned For
Owner Type
Purchase Details
Closed on
Nov 20, 2008
Sold by
Kepple Karen Sue and Kepple Michael L
Bought by
Kennedy Steve and Kennedy Brenda S
Current Estimated Value
Purchase Details
Closed on
May 25, 2006
Sold by
Miller Paul Eugene
Bought by
Kepple Karen Sue
Purchase Details
Closed on
Jul 14, 2005
Sold by
Mowery Karen Sue
Bought by
Greer Street Trust and Miller Paul Eugene
Purchase Details
Closed on
Dec 28, 1990
Sold by
Mowery Karen Sue and Mowery Workma
Bought by
Mowery Karen Sue and Mowery Workma
Purchase Details
Closed on
Dec 12, 1990
Sold by
Workman Helen L
Bought by
Mowery Karen Sue and Mowery Workma
Create a Home Valuation Report for This Property
The Home Valuation Report is an in-depth analysis detailing your home's value as well as a comparison with similar homes in the area
Home Values in the Area
Average Home Value in this Area
Purchase History
| Date | Buyer | Sale Price | Title Company |
|---|---|---|---|
| Kennedy Steve | $51,000 | None Available | |
| Kepple Karen Sue | -- | None Available | |
| Greer Street Trust | -- | None Available | |
| Mowery Karen Sue | $16,000 | -- | |
| Mowery Karen Sue | -- | -- |
Source: Public Records
Tax History Compared to Growth
Tax History
| Year | Tax Paid | Tax Assessment Tax Assessment Total Assessment is a certain percentage of the fair market value that is determined by local assessors to be the total taxable value of land and additions on the property. | Land | Improvement |
|---|---|---|---|---|
| 2024 | $1,751 | $44,270 | $9,190 | $35,080 |
| 2023 | $1,751 | $44,270 | $9,190 | $35,080 |
| 2022 | $1,540 | $35,410 | $7,350 | $28,060 |
| 2021 | $1,540 | $35,410 | $7,350 | $28,060 |
| 2020 | $1,500 | $35,410 | $7,350 | $28,060 |
| 2019 | $1,201 | $26,420 | $9,930 | $16,490 |
| 2018 | $1,204 | $26,420 | $9,930 | $16,490 |
| 2017 | $1,184 | $26,420 | $9,930 | $16,490 |
| 2016 | $1,099 | $24,460 | $9,190 | $15,270 |
| 2015 | $1,104 | $24,460 | $9,190 | $15,270 |
| 2014 | $1,109 | $24,460 | $9,190 | $15,270 |
| 2013 | $1,172 | $24,570 | $9,560 | $15,010 |
Source: Public Records
Map
Nearby Homes