Estimated Value: $142,000 - $311,082
4
Beds
2
Baths
906
Sq Ft
$274/Sq Ft
Est. Value
About This Home
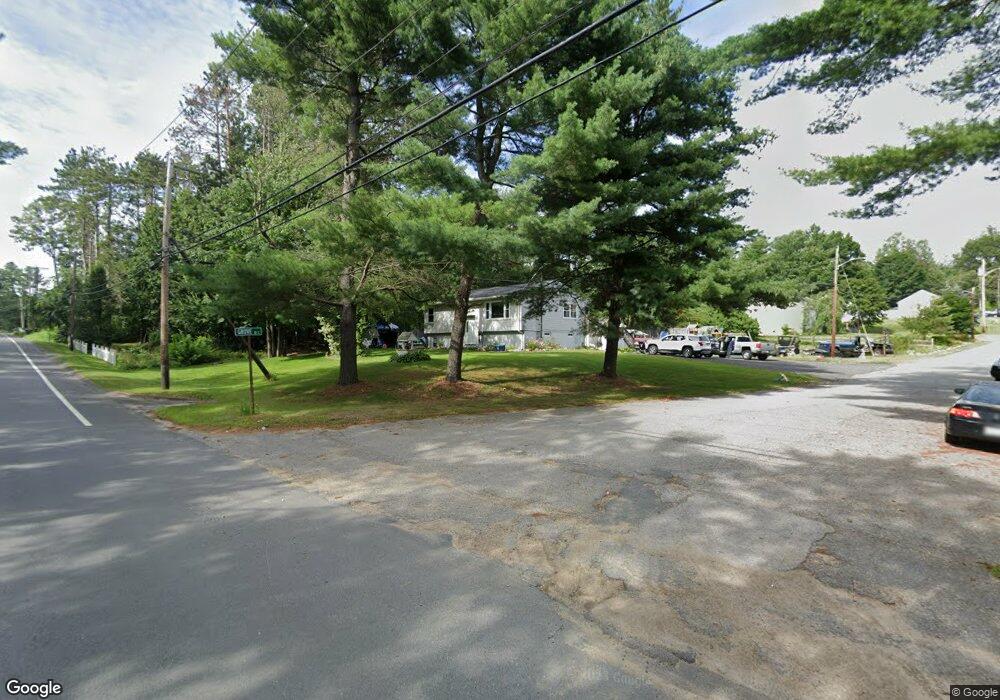
This home is located at 11 Grove St S, Barre, MA 01005 and is currently estimated at $248,271, approximately $274 per square foot. 11 Grove St S is a home located in Worcester County with nearby schools including Quabbin Regional Middle School and Quabbin Regional High School.
Ownership History
Date
Name
Owned For
Owner Type
Purchase Details
Closed on
Sep 7, 2007
Sold by
Morrison Donald L
Bought by
Morrison Angel M and Morrison Donald L
Current Estimated Value
Home Financials for this Owner
Home Financials are based on the most recent Mortgage that was taken out on this home.
Original Mortgage
$134,000
Outstanding Balance
$84,669
Interest Rate
6.71%
Mortgage Type
Purchase Money Mortgage
Estimated Equity
$163,602
Purchase Details
Closed on
Aug 31, 2007
Sold by
Department Of Housing & Urban Dev
Bought by
Morrison Donald L
Home Financials for this Owner
Home Financials are based on the most recent Mortgage that was taken out on this home.
Original Mortgage
$134,000
Outstanding Balance
$84,669
Interest Rate
6.71%
Mortgage Type
Purchase Money Mortgage
Estimated Equity
$163,602
Purchase Details
Closed on
Jun 20, 2007
Sold by
Wells Fargo Bank Na and Harmon Law Offices Pc
Bought by
Us Bk
Purchase Details
Closed on
May 21, 2007
Sold by
Ramsey David and Wells Fargo Bk
Bought by
Wells Fargo Bk
Purchase Details
Closed on
Jun 13, 2000
Sold by
Gerbrands Gerald R and Malouin Bernard
Bought by
Ramsey David
Home Financials for this Owner
Home Financials are based on the most recent Mortgage that was taken out on this home.
Original Mortgage
$111,977
Interest Rate
8.12%
Mortgage Type
Purchase Money Mortgage
Create a Home Valuation Report for This Property
The Home Valuation Report is an in-depth analysis detailing your home's value as well as a comparison with similar homes in the area
Home Values in the Area
Average Home Value in this Area
Purchase History
| Date | Buyer | Sale Price | Title Company |
|---|---|---|---|
| Morrison Angel M | -- | -- | |
| Morrison Donald L | $134,000 | -- | |
| Us Bk | -- | -- | |
| Wells Fargo Bk | $140,376 | -- | |
| Ramsey David | $112,900 | -- | |
| Morrison Angel M | -- | -- | |
| Morrison Donald L | $134,000 | -- | |
| Us Bk | -- | -- | |
| Wells Fargo Bk | $140,376 | -- | |
| Ramsey David | $112,900 | -- |
Source: Public Records
Mortgage History
| Date | Status | Borrower | Loan Amount |
|---|---|---|---|
| Open | Morrison Donald L | $134,000 | |
| Closed | Ramsey David | $134,000 | |
| Previous Owner | Ramsey David | $111,977 |
Source: Public Records
Tax History Compared to Growth
Tax History
| Year | Tax Paid | Tax Assessment Tax Assessment Total Assessment is a certain percentage of the fair market value that is determined by local assessors to be the total taxable value of land and additions on the property. | Land | Improvement |
|---|---|---|---|---|
| 2025 | $3,711 | $273,100 | $42,800 | $230,300 |
| 2024 | $3,636 | $260,100 | $40,800 | $219,300 |
| 2023 | $3,191 | $201,200 | $31,700 | $169,500 |
| 2022 | $2,947 | $175,000 | $27,100 | $147,900 |
| 2021 | $2,806 | $155,900 | $27,100 | $128,800 |
| 2020 | $2,663 | $149,000 | $27,100 | $121,900 |
| 2019 | $2,597 | $143,300 | $24,600 | $118,700 |
| 2018 | $2,647 | $140,800 | $24,600 | $116,200 |
| 2017 | $2,534 | $135,500 | $24,600 | $110,900 |
| 2016 | $2,351 | $132,100 | $22,400 | $109,700 |
| 2015 | $2,483 | $133,200 | $27,600 | $105,600 |
| 2014 | $2,131 | $132,700 | $33,800 | $98,900 |
Source: Public Records
Map
Nearby Homes