Estimated Value: $136,000 - $156,000
2
Beds
1
Bath
800
Sq Ft
$184/Sq Ft
Est. Value
About This Home
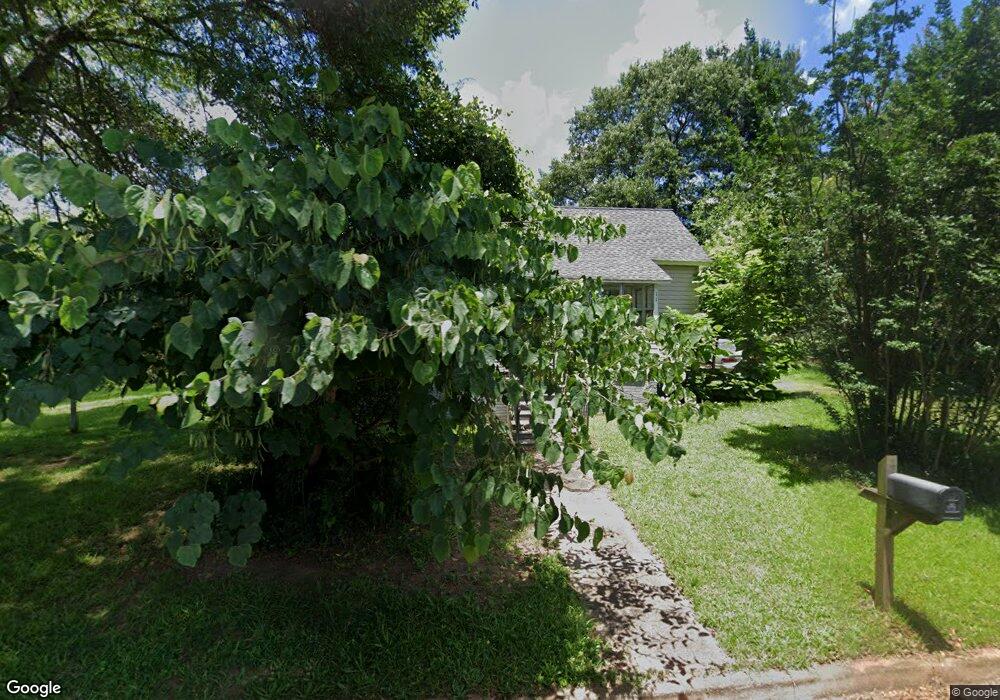
This home is located at 11 H St, Inman, SC 29349 and is currently estimated at $147,440, approximately $184 per square foot. 11 H St is a home located in Spartanburg County with nearby schools including Inman Elementary School, T.E. Mabry Middle School, and Chapman High School.
Ownership History
Date
Name
Owned For
Owner Type
Purchase Details
Closed on
Aug 29, 2016
Sold by
Glory Properties Llc
Bought by
Scorziel Gina M
Current Estimated Value
Home Financials for this Owner
Home Financials are based on the most recent Mortgage that was taken out on this home.
Original Mortgage
$73,052
Outstanding Balance
$58,790
Interest Rate
3.75%
Mortgage Type
FHA
Estimated Equity
$88,650
Purchase Details
Closed on
Jun 20, 2013
Sold by
Estate Of Robert Lee Smith
Bought by
Glory Properties Llc
Purchase Details
Closed on
Oct 15, 2010
Sold by
Smith Katherine Peace
Bought by
Smith Robert Lee
Purchase Details
Closed on
Jul 18, 2003
Sold by
Smith Katherine Peace
Bought by
Smith Robert Lee and Smith Katherine Peace
Create a Home Valuation Report for This Property
The Home Valuation Report is an in-depth analysis detailing your home's value as well as a comparison with similar homes in the area
Home Values in the Area
Average Home Value in this Area
Purchase History
| Date | Buyer | Sale Price | Title Company |
|---|---|---|---|
| Scorziel Gina M | $74,400 | None Available | |
| Glory Properties Llc | $25,000 | -- | |
| Smith Robert Lee | -- | -- | |
| Smith Robert Lee | -- | -- |
Source: Public Records
Mortgage History
| Date | Status | Borrower | Loan Amount |
|---|---|---|---|
| Open | Scorziel Gina M | $73,052 |
Source: Public Records
Tax History Compared to Growth
Tax History
| Year | Tax Paid | Tax Assessment Tax Assessment Total Assessment is a certain percentage of the fair market value that is determined by local assessors to be the total taxable value of land and additions on the property. | Land | Improvement |
|---|---|---|---|---|
| 2025 | $751 | $3,930 | $621 | $3,309 |
| 2024 | $751 | $3,930 | $621 | $3,309 |
| 2023 | $751 | $3,930 | $621 | $3,309 |
| 2022 | $678 | $3,418 | $440 | $2,978 |
| 2021 | $678 | $3,418 | $440 | $2,978 |
| 2020 | $664 | $3,418 | $440 | $2,978 |
| 2019 | $664 | $3,418 | $440 | $2,978 |
| 2018 | $696 | $3,418 | $440 | $2,978 |
| 2017 | $627 | $2,972 | $480 | $2,492 |
| 2016 | $1,610 | $3,666 | $720 | $2,946 |
| 2015 | $1,585 | $3,666 | $720 | $2,946 |
| 2014 | $1,585 | $3,666 | $720 | $2,946 |
Source: Public Records
Map
Nearby Homes