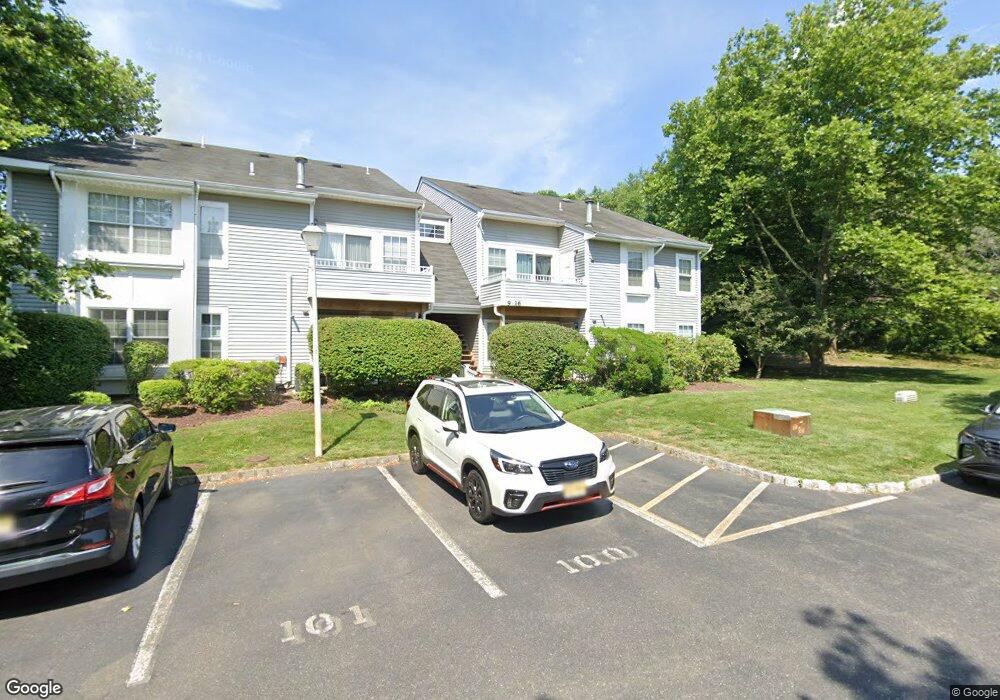
11 Hackamore Ct Unit 11 Tinton Falls, NJ 07753
Estimated Value: $374,407 - $443,000
2
Beds
1
Bath
1,011
Sq Ft
$401/Sq Ft
Est. Value
About This Home
This home is located at 11 Hackamore Ct Unit 11, Tinton Falls, NJ 07753 and is currently estimated at $405,852, approximately $401 per square foot. 11 Hackamore Ct Unit 11 is a home located in Monmouth County with nearby schools including Mahala F. Atchinson Elementary School, Swimming River Elementary School, and Tinton Falls Middle School.
Ownership History
Date
Name
Owned For
Owner Type
Purchase Details
Closed on
Mar 10, 2011
Sold by
Francese Frankie R
Bought by
Skahan Alison
Current Estimated Value
Home Financials for this Owner
Home Financials are based on the most recent Mortgage that was taken out on this home.
Original Mortgage
$161,802
Outstanding Balance
$114,818
Interest Rate
5.5%
Mortgage Type
FHA
Estimated Equity
$291,034
Purchase Details
Closed on
Jul 18, 2003
Sold by
Musella Sharyn
Bought by
Francese Frankie
Home Financials for this Owner
Home Financials are based on the most recent Mortgage that was taken out on this home.
Original Mortgage
$152,000
Interest Rate
6.29%
Purchase Details
Closed on
Mar 30, 1998
Sold by
Krienitz Kimberly
Bought by
Musella Sharyn
Home Financials for this Owner
Home Financials are based on the most recent Mortgage that was taken out on this home.
Original Mortgage
$67,000
Interest Rate
7.11%
Create a Home Valuation Report for This Property
The Home Valuation Report is an in-depth analysis detailing your home's value as well as a comparison with similar homes in the area
Home Values in the Area
Average Home Value in this Area
Purchase History
| Date | Buyer | Sale Price | Title Company |
|---|---|---|---|
| Skahan Alison | $178,000 | Multiple | |
| Francese Frankie | $190,000 | -- | |
| Musella Sharyn | $84,000 | -- |
Source: Public Records
Mortgage History
| Date | Status | Borrower | Loan Amount |
|---|---|---|---|
| Open | Skahan Alison | $161,802 | |
| Previous Owner | Francese Frankie | $152,000 | |
| Previous Owner | Musella Sharyn | $67,000 |
Source: Public Records
Tax History
| Year | Tax Paid | Tax Assessment Tax Assessment Total Assessment is a certain percentage of the fair market value that is determined by local assessors to be the total taxable value of land and additions on the property. | Land | Improvement |
|---|---|---|---|---|
| 2025 | $5,324 | $384,000 | $211,500 | $172,500 |
| 2024 | $4,784 | $370,000 | $201,500 | $168,500 |
Source: Public Records
Map
Nearby Homes
- 1 Thoroughbred Fare
- 7 Bugle Way
- 4 Gait Ct Unit 4
- 62 Santa Rosa Ln
- 62 Horseshoe Ct Unit 54
- 1 Canidae Ct Unit 1
- 5 Mount Run
- 133 Frontier Way
- 18 Charles Dr
- 18 Diane Dr
- 52 Diane Dr
- 13 Cranberry Dr
- 78 Diane Dr
- 75 Diane Dr
- 24 Karen Dr
- 9 Bismark St Unit 433
- 54 Des Moines Ct
- 25 Des Moines Ct
- 422 Green Grove Rd
- 19 Phoenix Ct
- 12 Hackamore Ct
- 10 Hackamore Ct
- 9 Hackamore Ct
- 15 Hackamore Ct
- 13 Hackamore Ct
- 16 Hackamore Ct
- 14 Hackamore Ct
- 31 Thoroughbred Fare
- 29 Thoroughbred Fare
- 24 Hackamore Ct Unit 24
- 32 Thoroughbred Fare Unit 32
- 6 Hackamore Ct
- 5 Hackamore Ct Unit 5
- 23 Hackamore Ct
- 30 Thoroughbred Fare
- 20 Hackamore Ct
- 7 Hackamore Ct
- 22 Hackamore Ct
- 8 Hackamore Ct
- 19 Hackamore Ct
Your Personal Tour Guide
Ask me questions while you tour the home.