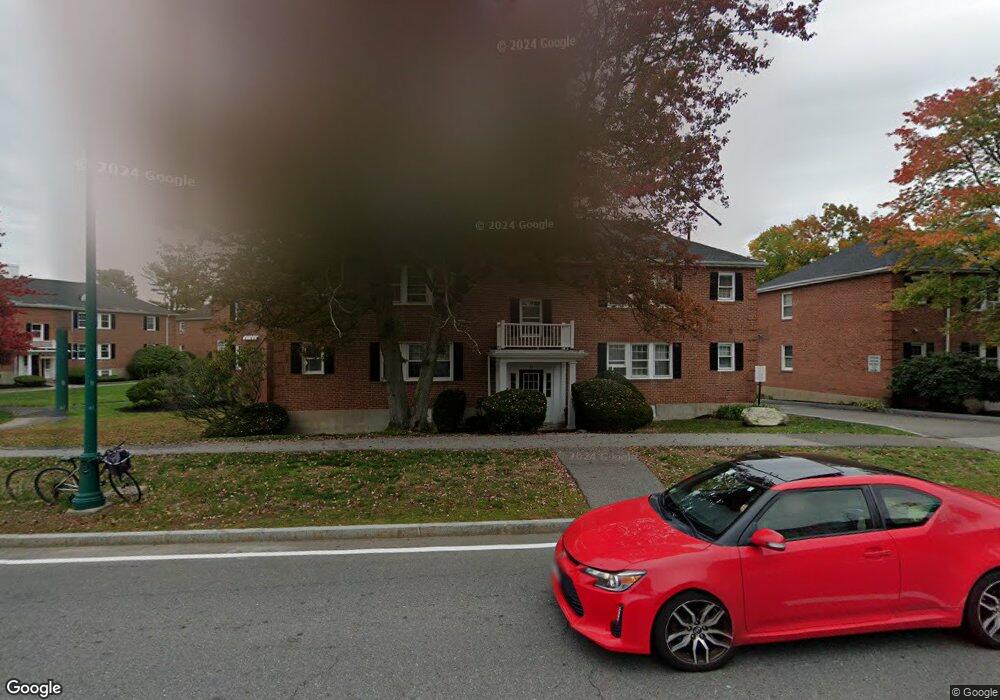
11 Hammond Pond Pkwy Unit 2 Chestnut Hill, MA 02467
Chestnut Hill NeighborhoodEstimated Value: $449,000 - $547,000
1
Bed
1
Bath
710
Sq Ft
$695/Sq Ft
Est. Value
About This Home
This home is located at 11 Hammond Pond Pkwy Unit 2, Chestnut Hill, MA 02467 and is currently estimated at $493,307, approximately $694 per square foot. 11 Hammond Pond Pkwy Unit 2 is a home with nearby schools including Bowen School, Oak Hill Middle School, and Newton South High School.
Ownership History
Date
Name
Owned For
Owner Type
Purchase Details
Closed on
Feb 18, 2021
Sold by
Sullivan Debra M
Bought by
Debra M Sullivan Ret
Current Estimated Value
Purchase Details
Closed on
Jan 16, 2004
Sold by
Lipof Mark H
Bought by
Sullivan Debra M
Home Financials for this Owner
Home Financials are based on the most recent Mortgage that was taken out on this home.
Original Mortgage
$150,100
Interest Rate
5.98%
Mortgage Type
Purchase Money Mortgage
Purchase Details
Closed on
Jul 29, 1997
Sold by
Maple William P and Maple Marnie O
Bought by
Lipof Mark H
Home Financials for this Owner
Home Financials are based on the most recent Mortgage that was taken out on this home.
Original Mortgage
$95,200
Interest Rate
7.7%
Mortgage Type
Purchase Money Mortgage
Create a Home Valuation Report for This Property
The Home Valuation Report is an in-depth analysis detailing your home's value as well as a comparison with similar homes in the area
Home Values in the Area
Average Home Value in this Area
Purchase History
| Date | Buyer | Sale Price | Title Company |
|---|---|---|---|
| Debra M Sullivan Ret | -- | None Available | |
| Sullivan Debra M | $265,000 | -- | |
| Lipof Mark H | $119,000 | -- |
Source: Public Records
Mortgage History
| Date | Status | Borrower | Loan Amount |
|---|---|---|---|
| Previous Owner | Lipof Mark H | $126,500 | |
| Previous Owner | Sullivan Debra M | $150,100 | |
| Previous Owner | Lipof Mark H | $105,000 | |
| Previous Owner | Lipof Mark H | $95,200 |
Source: Public Records
Tax History Compared to Growth
Tax History
| Year | Tax Paid | Tax Assessment Tax Assessment Total Assessment is a certain percentage of the fair market value that is determined by local assessors to be the total taxable value of land and additions on the property. | Land | Improvement |
|---|---|---|---|---|
| 2025 | $4,178 | $426,300 | $0 | $426,300 |
| 2024 | $4,040 | $413,900 | $0 | $413,900 |
| 2023 | $3,875 | $380,600 | $0 | $380,600 |
| 2022 | $4,004 | $380,600 | $0 | $380,600 |
| 2021 | $4,095 | $380,600 | $0 | $380,600 |
| 2020 | $3,973 | $380,600 | $0 | $380,600 |
| 2019 | $3,861 | $369,500 | $0 | $369,500 |
| 2018 | $3,639 | $336,300 | $0 | $336,300 |
| 2017 | $3,528 | $317,300 | $0 | $317,300 |
| 2016 | $3,343 | $293,800 | $0 | $293,800 |
| 2015 | $3,248 | $279,800 | $0 | $279,800 |
Source: Public Records
Map
Nearby Homes
- 11 Hammond Pond Pkwy Unit 3
- 33 Hammond Pond Pkwy Unit 2
- 15 Glenland Rd
- 321 Hammond Pond Pkwy Unit 103
- 321 Hammond Pond Pkwy Unit 301
- 771 Heath St Unit 771
- 809-811 Heath St Unit 811
- 799 Heath St Unit 2
- 811 Heath St
- 5 Heathwood Ln
- 280 Boylston St Unit 203
- 280 Boylston St Unit 905
- 280 Boylston St Unit 710
- 280 Boylston St Unit 908
- 280 Boylston St Unit 415
- 280 Boylston St Unit 511
- 250 Hammond Pond Pkwy Unit 1604N
- 250 Hammond Pond Pkwy Unit 1002N
- 250 Hammond Pond Pkwy Unit 614S
- 250 Hammond Pond Pkwy Unit 603S
- 23 Hammond Pond Pkwy Unit 3
- 23 Hammond Pond Pkwy Unit 1
- 21 Hammond Pond Pkwy Unit 4
- 21 Hammond Pond Pkwy Unit 3
- 21 Hammond Pond Pkwy Unit 1
- 11 Hammond Pond Pkwy Unit 4
- 9 Hammond Pond Pkwy Unit 4
- 9 Hammond Pond Pkwy Unit 2
- 9 Hammond Pond Pkwy Unit 1
- 7 Hammond Pond Pkwy Unit 3
- 90 Boylston St Unit 4
- 90 Boylston St Unit 3
- 90 Boylston St Unit 2
- 90 Boylston St Unit 1
- 23 Hammond Pond Pkwy Unit 4
- 7 Hammond Pond Pkwy Unit 2
- 90 Boylston St Unit 2,90
- 11 Hammond Pond Pkwy Unit 103
- 11 Hammond Pond Pkwy Unit 203
- 21 Hammond Pond Pkwy Unit 2