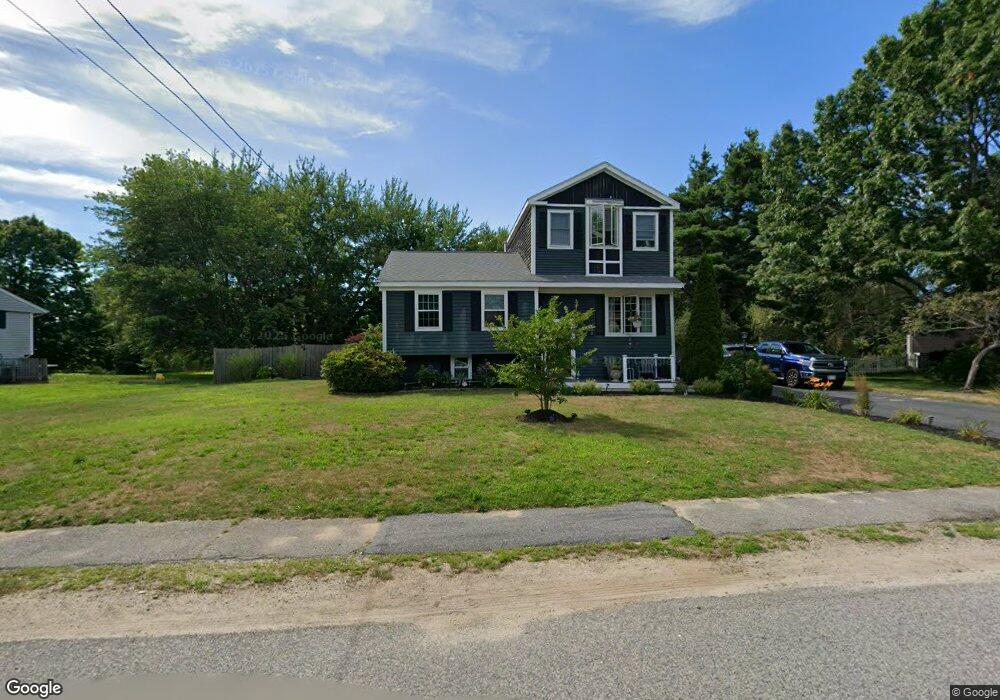
11 Harlow Rd Marshfield, MA 02050
Estimated Value: $635,000 - $756,000
3
Beds
1
Bath
972
Sq Ft
$722/Sq Ft
Est. Value
About This Home
This home is located at 11 Harlow Rd, Marshfield, MA 02050 and is currently estimated at $701,957, approximately $722 per square foot. 11 Harlow Rd is a home located in Plymouth County with nearby schools including Daniel Webster, Furnace Brook Middle School, and Marshfield High School.
Ownership History
Date
Name
Owned For
Owner Type
Purchase Details
Closed on
Apr 30, 2001
Sold by
Wright Daniel P and Wright Cheryl A
Bought by
Reynolds Brian P and Reynolds Dawn E
Current Estimated Value
Purchase Details
Closed on
Oct 15, 1998
Sold by
Vaughan Tommy L and Vaughan Kerry L
Bought by
Wright Daniel P and Wright Cheryl A
Purchase Details
Closed on
Apr 15, 1998
Sold by
Fnma
Bought by
Vaughan Tommy L and Vaughan Kerry L
Purchase Details
Closed on
Jan 9, 1998
Sold by
Reimer Michael E
Bought by
Federal National Mortgage Association
Purchase Details
Closed on
Mar 29, 1990
Sold by
Reimer Thomas M
Bought by
Reimer Michael E
Create a Home Valuation Report for This Property
The Home Valuation Report is an in-depth analysis detailing your home's value as well as a comparison with similar homes in the area
Home Values in the Area
Average Home Value in this Area
Purchase History
We collect this data history from publicly available records. To have your information removed, we recommend requesting removal directly through your county’s website.
| Date | Buyer | Sale Price | Title Company |
|---|---|---|---|
| Reynolds Brian P | $200,000 | -- | |
| Reynolds Brian P | $200,000 | -- | |
| Wright Daniel P | $146,500 | -- | |
| Wright Daniel P | $146,500 | -- | |
| Vaughan Tommy L | $126,500 | -- | |
| Vaughan Tommy L | $126,500 | -- | |
| Federal National Mortgage Association | $114,300 | -- | |
| Federal National Mortgage Association | $114,300 | -- | |
| Reimer Michael E | $155,000 | -- |
Source: Public Records
Mortgage History
We collect this data history from publicly available records. To have your information removed, we recommend requesting removal directly through your county’s website.
| Date | Status | Borrower | Loan Amount |
|---|---|---|---|
| Open | Reimer Michael E | $250,000 | |
| Closed | Reimer Michael E | $255,000 |
Source: Public Records
Tax History
| Year | Tax Paid | Tax Assessment Tax Assessment Total Assessment is a certain percentage of the fair market value that is determined by local assessors to be the total taxable value of land and additions on the property. | Land | Improvement |
|---|---|---|---|---|
| 2025 | $6,051 | $611,200 | $302,800 | $308,400 |
| 2024 | $5,814 | $559,600 | $288,400 | $271,200 |
| 2023 | $5,233 | $500,500 | $257,500 | $243,000 |
| 2022 | $5,233 | $404,100 | $216,300 | $187,800 |
| 2021 | $5,033 | $381,600 | $216,300 | $165,300 |
| 2020 | $4,705 | $353,000 | $195,700 | $157,300 |
| 2019 | $4,723 | $353,000 | $195,700 | $157,300 |
| 2018 | $4,720 | $353,000 | $195,700 | $157,300 |
| 2017 | $4,444 | $323,900 | $195,700 | $128,200 |
| 2016 | $4,362 | $314,300 | $195,700 | $118,600 |
| 2015 | $4,177 | $314,300 | $195,700 | $118,600 |
| 2014 | $3,943 | $296,700 | $195,700 | $101,000 |
Source: Public Records
Map
Nearby Homes
- 19 Copeland St
- 713 Webster St
- 134 Wellington Ave
- 18 Somerville St
- 155 Quincy Ave
- 1221 Ocean St
- 46 Fairways Edge Dr
- 555 Webster St
- 21 Washington Ave
- 757 S River St
- 91 Winslow St
- 599 Moraine St
- 8 Duxbury St
- 54 Longview Terrace
- 152 Acorn St
- 1028 Ocean St
- 14 Ivy St
- 264 Webster St
- 184 King Phillips Pathe
- 24 Proctor St
Your Personal Tour Guide
Ask me questions while you tour the home.