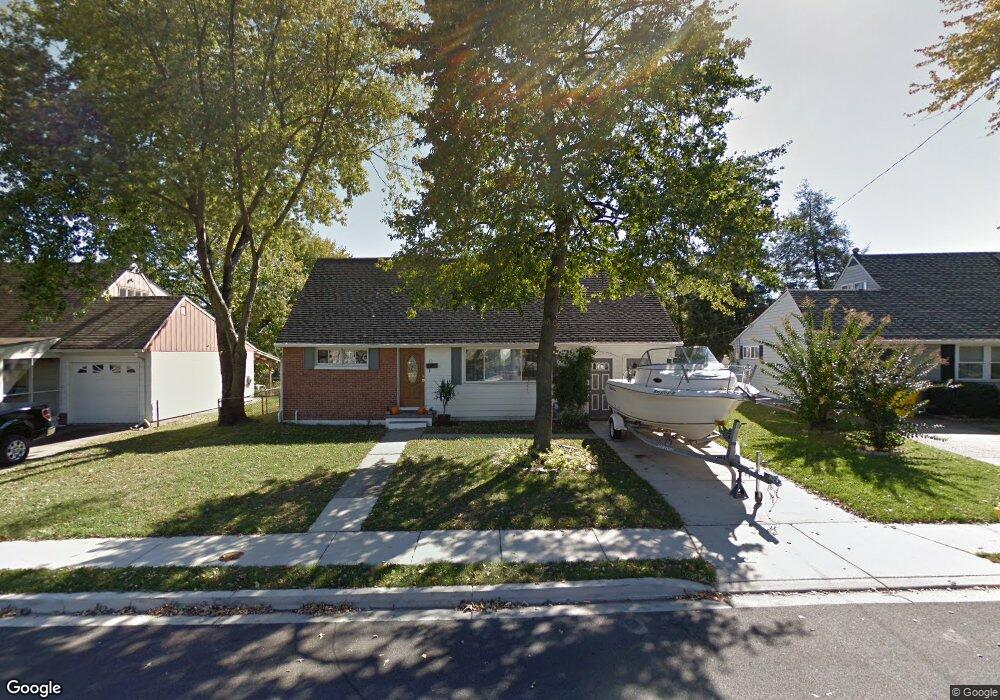
11 Harvard Rd Glen Burnie, MD 21060
Estimated Value: $395,238 - $431,000
4
Beds
3
Baths
1,513
Sq Ft
$274/Sq Ft
Est. Value
About This Home
This home is located at 11 Harvard Rd, Glen Burnie, MD 21060 and is currently estimated at $414,810, approximately $274 per square foot. 11 Harvard Rd is a home located in Anne Arundel County with nearby schools including Point Pleasant Elementary School, Marley Middle School, and Glen Burnie High School.
Ownership History
Date
Name
Owned For
Owner Type
Purchase Details
Closed on
May 23, 2014
Sold by
Dincher Joseph M and Dincher Benjamine A
Bought by
Dincher Joseph M
Current Estimated Value
Home Financials for this Owner
Home Financials are based on the most recent Mortgage that was taken out on this home.
Original Mortgage
$239,875
Outstanding Balance
$183,086
Interest Rate
4.37%
Mortgage Type
FHA
Estimated Equity
$231,724
Purchase Details
Closed on
Aug 17, 2009
Sold by
Abell Vincent
Bought by
National City Bank
Purchase Details
Closed on
Jun 30, 2009
Sold by
National City Bank
Bought by
Sutherland James B
Purchase Details
Closed on
Jan 12, 2006
Sold by
Sade Douglas R
Bought by
Abell Vincent
Purchase Details
Closed on
Apr 14, 2004
Sold by
Sade Douglas R
Bought by
Abell Vincent
Purchase Details
Closed on
Jan 14, 2000
Sold by
Pita Isabel
Bought by
Sade Douglas R and Sade Sheila M
Create a Home Valuation Report for This Property
The Home Valuation Report is an in-depth analysis detailing your home's value as well as a comparison with similar homes in the area
Home Values in the Area
Average Home Value in this Area
Purchase History
| Date | Buyer | Sale Price | Title Company |
|---|---|---|---|
| Dincher Joseph M | $58,008 | None Available | |
| National City Bank | $129,000 | -- | |
| Sutherland James B | $125,000 | -- | |
| Abell Vincent | -- | -- | |
| Abell Vincent | -- | -- | |
| Sade Douglas R | $115,000 | -- |
Source: Public Records
Mortgage History
| Date | Status | Borrower | Loan Amount |
|---|---|---|---|
| Open | Dincher Joseph M | $239,875 |
Source: Public Records
Tax History Compared to Growth
Tax History
| Year | Tax Paid | Tax Assessment Tax Assessment Total Assessment is a certain percentage of the fair market value that is determined by local assessors to be the total taxable value of land and additions on the property. | Land | Improvement |
|---|---|---|---|---|
| 2025 | $3,240 | $340,800 | $159,900 | $180,900 |
| 2024 | $3,240 | $313,867 | $0 | $0 |
| 2023 | $3,127 | $286,933 | $0 | $0 |
| 2022 | $2,899 | $260,000 | $123,800 | $136,200 |
| 2021 | $5,711 | $259,633 | $0 | $0 |
| 2020 | $2,772 | $259,267 | $0 | $0 |
| 2019 | $2,733 | $258,900 | $113,800 | $145,100 |
| 2018 | $2,451 | $241,667 | $0 | $0 |
| 2017 | $2,551 | $224,433 | $0 | $0 |
| 2016 | -- | $207,200 | $0 | $0 |
| 2015 | -- | $207,200 | $0 | $0 |
| 2014 | -- | $207,200 | $0 | $0 |
Source: Public Records
Map
Nearby Homes
- 134 Alview Terrace
- 36 Elm Dr
- 26 Elm Dr
- 898 Marigold Rd
- 98 Forest Rd
- 15 Beach Rd
- 1 Beach Rd
- 400 Summit Ave
- 7602 Mcgowan Ave
- 510 Creek Crossing Ln
- 143 Midland Rd
- 110 Northdale Rd
- 210 Saltgrass Dr Unit 210
- 146 Midland Rd
- 145 Forest Rd
- 217 Saltgrass Dr Unit 217
- 7847 Leymar Rd
- 149 Forest Rd
- 153 Forest Rd
- 157 Forest Rd