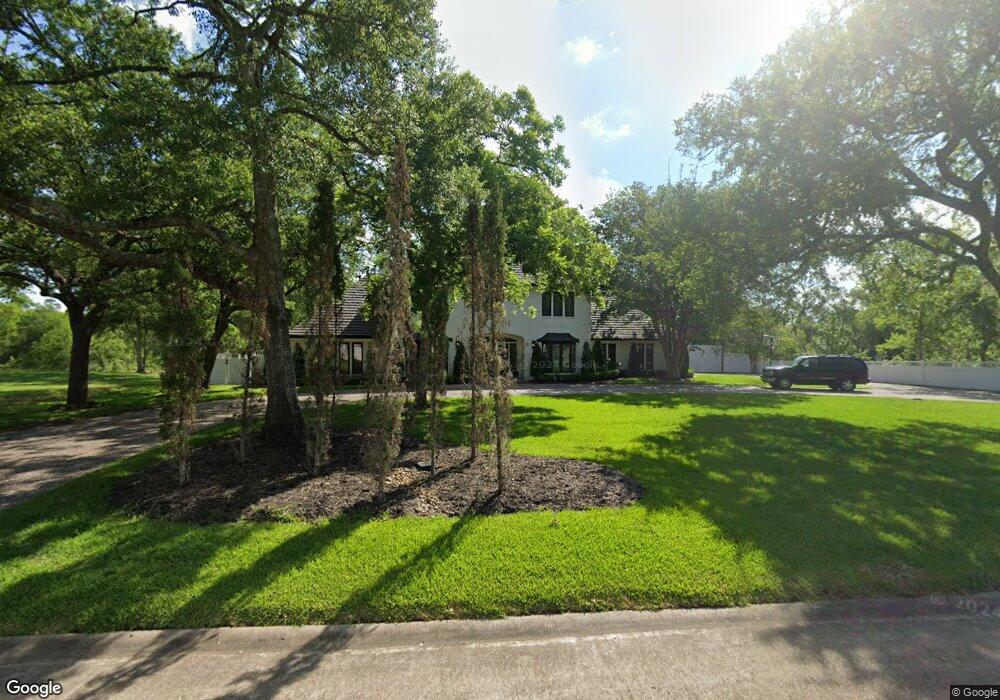
11 Haverford Ln Friendswood, TX 77546
Estimated Value: $761,000 - $798,000
5
Beds
5
Baths
4,623
Sq Ft
$167/Sq Ft
Est. Value
About This Home
This home is located at 11 Haverford Ln, Friendswood, TX 77546 and is currently estimated at $773,508, approximately $167 per square foot. 11 Haverford Ln is a home located in Galveston County with nearby schools including Westwood Elementary School, Zue S. Bales Intermediate School, and Friendswood Junior High School.
Ownership History
Date
Name
Owned For
Owner Type
Purchase Details
Closed on
Dec 22, 2016
Sold by
Wolston Clinton M and Wolston Barbara I
Bought by
Willis Nicole and Willis Jamen
Current Estimated Value
Home Financials for this Owner
Home Financials are based on the most recent Mortgage that was taken out on this home.
Original Mortgage
$407,361
Outstanding Balance
$329,443
Interest Rate
3.57%
Mortgage Type
New Conventional
Estimated Equity
$444,065
Purchase Details
Closed on
Jan 9, 2009
Sold by
E Gerry Trust Inc
Bought by
Hill Fleta A and Crutcher Joe
Purchase Details
Closed on
Nov 6, 2007
Sold by
Hill Fleta A and Crutcher Joe
Bought by
E Gerry Trust Inc
Home Financials for this Owner
Home Financials are based on the most recent Mortgage that was taken out on this home.
Original Mortgage
$299,000
Interest Rate
6.42%
Mortgage Type
Seller Take Back
Create a Home Valuation Report for This Property
The Home Valuation Report is an in-depth analysis detailing your home's value as well as a comparison with similar homes in the area
Home Values in the Area
Average Home Value in this Area
Purchase History
| Date | Buyer | Sale Price | Title Company |
|---|---|---|---|
| Willis Nicole | -- | Great American Title | |
| Hill Fleta A | $299,000 | None Available | |
| E Gerry Trust Inc | -- | South Land Title Company |
Source: Public Records
Mortgage History
| Date | Status | Borrower | Loan Amount |
|---|---|---|---|
| Open | Willis Nicole | $407,361 | |
| Previous Owner | E Gerry Trust Inc | $299,000 |
Source: Public Records
Tax History Compared to Growth
Tax History
| Year | Tax Paid | Tax Assessment Tax Assessment Total Assessment is a certain percentage of the fair market value that is determined by local assessors to be the total taxable value of land and additions on the property. | Land | Improvement |
|---|---|---|---|---|
| 2025 | $11,227 | $741,829 | -- | -- |
| 2024 | $11,227 | $674,390 | $57,880 | $616,510 |
| 2023 | $11,227 | $665,500 | $0 | $0 |
| 2022 | $13,325 | $605,000 | $0 | $0 |
| 2021 | $12,846 | $550,000 | $57,880 | $492,120 |
| 2020 | $12,208 | $506,740 | $57,880 | $448,860 |
| 2019 | $13,792 | $543,150 | $25,940 | $517,210 |
| 2018 | $8,689 | $340,160 | $25,940 | $314,220 |
| 2017 | $14,442 | $556,090 | $25,940 | $530,150 |
| 2016 | $11,528 | $443,900 | $25,940 | $417,960 |
| 2015 | $4,417 | $388,920 | $25,940 | $362,980 |
| 2014 | $3,798 | $260,000 | $25,940 | $234,060 |
Source: Public Records
Map
Nearby Homes
- 14 Haverford Ln
- Lots 29 and 42 Block Wedgewood Village Dr
- 5402 Royal Pkwy
- 5339 Appleblossom Ln
- 5343 Royal Pkwy
- 716 Penn Dr
- 508 Williamsburg Cir
- 198 Quaker Dr
- 200 Quaker Dr
- 206 Quaker Dr
- 5323 Abercreek Ave
- 503 Independence Dr
- 16303 Townes Rd
- 16114 Forest Bend Ave
- 407 Colonial Dr
- 501 Colonial Dr
- 16222 Forest Bend Ave
- 5498 Apple Blossom Ln
- 5202 Apple Blossom Ln
- 103 Echo Ave
- 13 Haverford Ln
- 12 Haverford Ln
- 15 Haverford Ln
- 16 Haverford Ln
- 5 Haverford Ln
- 9 Earlham Dr
- 7 Earlham Dr
- 13 Earlham Dr
- 408 Clearview Ave
- 406 Clearview Ave
- 5 Earlham Dr
- 404 Clearview Ave
- 3 Earlham Dr
- 410 Clearview Ave
- 4 Haverford Ln
- 402 Clearview Ave
- 3 Haverford Ln
- 14 Earlham Dr
- 1 Earlham Dr
- 16202 Creekview Ct