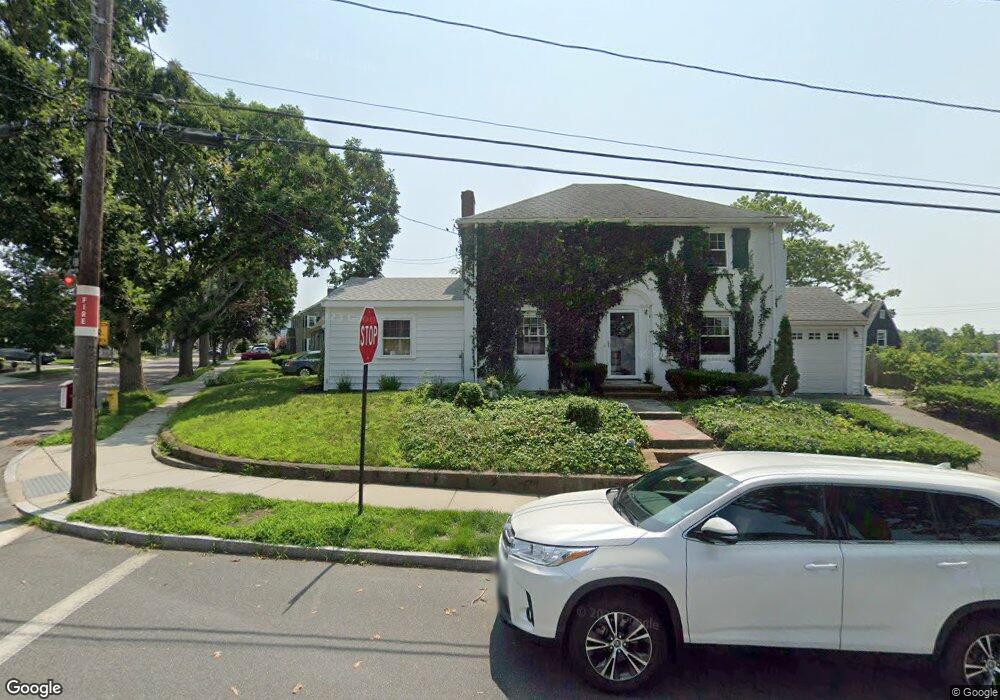
11 Havilend St Quincy, MA 02170
Wollaston NeighborhoodEstimated Value: $780,000 - $829,329
3
Beds
2
Baths
1,440
Sq Ft
$555/Sq Ft
Est. Value
About This Home
This home is located at 11 Havilend St, Quincy, MA 02170 and is currently estimated at $799,082, approximately $554 per square foot. 11 Havilend St is a home located in Norfolk County with nearby schools including Beechwood Knoll Elementary School, Central Middle School, and North Quincy High School.
Ownership History
Date
Name
Owned For
Owner Type
Purchase Details
Closed on
Aug 1, 2014
Sold by
Kircheis David and Kircheis Danfeng
Bought by
Trainor-Scott Stacy L and Scott Stacy L
Current Estimated Value
Home Financials for this Owner
Home Financials are based on the most recent Mortgage that was taken out on this home.
Original Mortgage
$271,750
Outstanding Balance
$207,750
Interest Rate
4.18%
Mortgage Type
New Conventional
Estimated Equity
$591,332
Purchase Details
Closed on
Dec 8, 2008
Sold by
Robert F Rice Irt and Rice Thomas F
Bought by
Kircheis David
Home Financials for this Owner
Home Financials are based on the most recent Mortgage that was taken out on this home.
Original Mortgage
$180,500
Interest Rate
6.11%
Mortgage Type
Purchase Money Mortgage
Purchase Details
Closed on
May 11, 2005
Sold by
Int Rice and Rice Robert F
Bought by
Robert F Rice Irt and Rice Thomas F
Create a Home Valuation Report for This Property
The Home Valuation Report is an in-depth analysis detailing your home's value as well as a comparison with similar homes in the area
Home Values in the Area
Average Home Value in this Area
Purchase History
| Date | Buyer | Sale Price | Title Company |
|---|---|---|---|
| Trainor-Scott Stacy L | $421,750 | -- | |
| Kircheis David | $380,500 | -- | |
| Robert F Rice Irt | -- | -- |
Source: Public Records
Mortgage History
| Date | Status | Borrower | Loan Amount |
|---|---|---|---|
| Open | Trainor-Scott Stacy L | $271,750 | |
| Previous Owner | Kircheis David | $180,500 |
Source: Public Records
Tax History Compared to Growth
Tax History
| Year | Tax Paid | Tax Assessment Tax Assessment Total Assessment is a certain percentage of the fair market value that is determined by local assessors to be the total taxable value of land and additions on the property. | Land | Improvement |
|---|---|---|---|---|
| 2025 | $8,543 | $740,900 | $347,900 | $393,000 |
| 2024 | $8,268 | $733,600 | $347,900 | $385,700 |
| 2023 | $7,690 | $690,900 | $331,300 | $359,600 |
| 2022 | $6,750 | $563,400 | $265,000 | $298,400 |
| 2021 | $6,545 | $539,100 | $265,000 | $274,100 |
| 2020 | $6,388 | $513,900 | $265,000 | $248,900 |
| 2019 | $6,078 | $484,300 | $247,700 | $236,600 |
| 2018 | $5,928 | $444,400 | $225,200 | $219,200 |
| 2017 | $6,002 | $423,600 | $225,200 | $198,400 |
| 2016 | $5,599 | $389,900 | $204,700 | $185,200 |
| 2015 | $5,301 | $363,100 | $186,100 | $177,000 |
| 2014 | $5,055 | $340,200 | $177,200 | $163,000 |
Source: Public Records
Map
Nearby Homes
- 14 Ridgeway St
- 100 Thornton St
- 123 Waterston Ave
- 41 Randlett St
- 72 Waterston Ave
- 35 Estabrook Rd
- 65 - 67 Davis St
- 101 Beach St
- 158 W Elm Ave
- 22 Beach St
- 14 Maypole Rd
- 88 Furnace Brook Pkwy
- 163 Clay St Unit C
- 1333 Quincy Shore Dr
- 43 Ellington Rd
- 77 Samoset Ave
- 80 Squanto Rd
- 22 Newton Ave
- 14 Samoset Ave
- 33 Samoset Ave