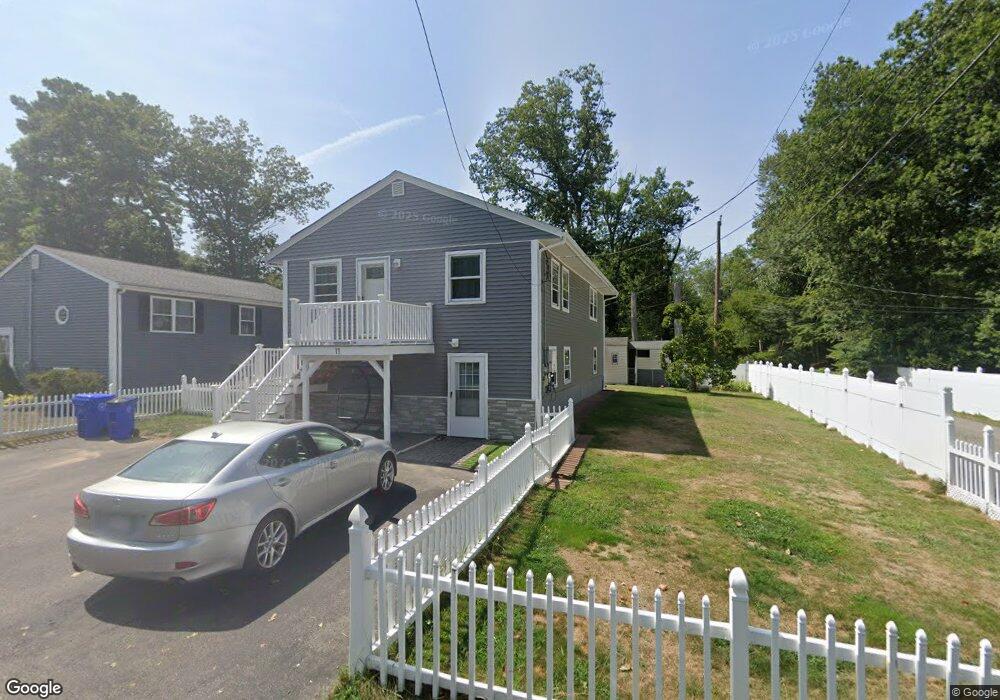
11 Hemlock Rd Holbrook, MA 02343
Estimated Value: $544,000 - $575,000
4
Beds
2
Baths
1,900
Sq Ft
$292/Sq Ft
Est. Value
About This Home
This home is located at 11 Hemlock Rd, Holbrook, MA 02343 and is currently estimated at $554,017, approximately $291 per square foot. 11 Hemlock Rd is a home located in Norfolk County with nearby schools including John F. Kennedy Elementary School, Holbrook Middle High School, and Boston Higashi School.
Ownership History
Date
Name
Owned For
Owner Type
Purchase Details
Closed on
Nov 28, 2003
Sold by
Marra Debra A
Bought by
Fung Candy C and Yuen Ho K
Current Estimated Value
Home Financials for this Owner
Home Financials are based on the most recent Mortgage that was taken out on this home.
Original Mortgage
$130,000
Outstanding Balance
$61,122
Interest Rate
6.09%
Mortgage Type
Purchase Money Mortgage
Estimated Equity
$492,895
Purchase Details
Closed on
Mar 2, 2001
Sold by
Stetson Rose L
Bought by
Marra Debra A
Purchase Details
Closed on
Jul 31, 1998
Sold by
Papineau Tr Paula J
Bought by
Stetson Rose L
Home Financials for this Owner
Home Financials are based on the most recent Mortgage that was taken out on this home.
Original Mortgage
$75,000
Interest Rate
6.92%
Mortgage Type
Purchase Money Mortgage
Create a Home Valuation Report for This Property
The Home Valuation Report is an in-depth analysis detailing your home's value as well as a comparison with similar homes in the area
Home Values in the Area
Average Home Value in this Area
Purchase History
| Date | Buyer | Sale Price | Title Company |
|---|---|---|---|
| Fung Candy C | $265,000 | -- | |
| Fung Candy C | $265,000 | -- | |
| Marra Debra A | $182,000 | -- | |
| Stetson Rose L | $124,900 | -- | |
| Stetson Rose L | $124,900 | -- |
Source: Public Records
Mortgage History
| Date | Status | Borrower | Loan Amount |
|---|---|---|---|
| Open | Stetson Rose L | $130,000 | |
| Closed | Stetson Rose L | $130,000 | |
| Previous Owner | Stetson Rose L | $75,000 |
Source: Public Records
Tax History
| Year | Tax Paid | Tax Assessment Tax Assessment Total Assessment is a certain percentage of the fair market value that is determined by local assessors to be the total taxable value of land and additions on the property. | Land | Improvement |
|---|---|---|---|---|
| 2025 | $60 | $453,300 | $185,900 | $267,400 |
| 2024 | $5,868 | $436,600 | $185,700 | $250,900 |
| 2023 | $6,227 | $404,900 | $168,800 | $236,100 |
| 2022 | $5,988 | $363,100 | $153,500 | $209,600 |
| 2021 | $5,808 | $337,300 | $139,200 | $198,100 |
| 2020 | $6,027 | $328,100 | $135,000 | $193,100 |
| 2019 | $5,970 | $306,800 | $126,400 | $180,400 |
| 2018 | $6,011 | $290,800 | $117,000 | $173,800 |
| 2017 | $5,679 | $271,700 | $106,200 | $165,500 |
| 2016 | $5,218 | $265,700 | $103,500 | $162,200 |
| 2015 | $4,858 | $254,600 | $99,000 | $155,600 |
| 2014 | $4,655 | $248,000 | $99,000 | $149,000 |
Source: Public Records
Map
Nearby Homes
- 27 Valley Rd
- 19 Overlook Rd
- 36 Kalmia Rd
- 14 Washington Cir
- 375 S Franklin St Unit 1
- 0 Payson Ave
- 610 S Franklin St Unit F102
- 14 Leonard Ln
- 7 Oakwood Ave
- 660 S Franklin St
- 276 Center St
- 181 S Franklin St Unit 102
- 181 S Franklin St Unit 206
- 5 Patterson Ave E
- 37 Reeds Ln
- 152 S Franklin St
- 52 Quincy St
- 95 Rindone St
- 719 S Franklin St Unit C Block 1
- 747 S Main St
Your Personal Tour Guide
Ask me questions while you tour the home.