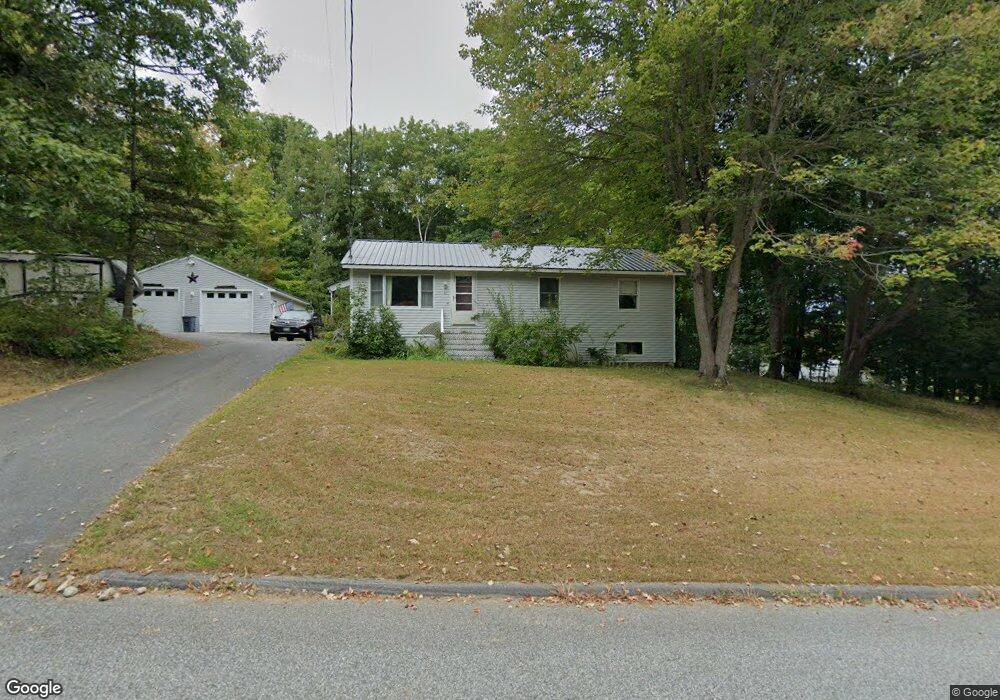
11 Higgins St Lisbon Falls, ME 04252
Estimated Value: $303,000 - $336,108
3
Beds
1
Bath
1,008
Sq Ft
$320/Sq Ft
Est. Value
About This Home
This home is located at 11 Higgins St, Lisbon Falls, ME 04252 and is currently estimated at $323,027, approximately $320 per square foot. 11 Higgins St is a home with nearby schools including Lisbon Community School, Philip W. Sugg Middle School, and Lisbon High School.
Ownership History
Date
Name
Owned For
Owner Type
Purchase Details
Closed on
Oct 5, 2007
Sold by
Morin Donald A
Bought by
Morin Pauline C
Current Estimated Value
Home Financials for this Owner
Home Financials are based on the most recent Mortgage that was taken out on this home.
Original Mortgage
$123,450
Outstanding Balance
$78,596
Interest Rate
6.59%
Mortgage Type
FHA
Estimated Equity
$244,431
Create a Home Valuation Report for This Property
The Home Valuation Report is an in-depth analysis detailing your home's value as well as a comparison with similar homes in the area
Home Values in the Area
Average Home Value in this Area
Purchase History
| Date | Buyer | Sale Price | Title Company |
|---|---|---|---|
| Morin Pauline C | -- | -- |
Source: Public Records
Mortgage History
| Date | Status | Borrower | Loan Amount |
|---|---|---|---|
| Open | Morin Pauline C | $123,450 |
Source: Public Records
Tax History Compared to Growth
Tax History
| Year | Tax Paid | Tax Assessment Tax Assessment Total Assessment is a certain percentage of the fair market value that is determined by local assessors to be the total taxable value of land and additions on the property. | Land | Improvement |
|---|---|---|---|---|
| 2024 | $3,533 | $259,800 | $59,900 | $199,900 |
| 2023 | $3,171 | $150,300 | $39,500 | $110,800 |
| 2022 | $3,472 | $150,300 | $39,500 | $110,800 |
| 2021 | $3,322 | $150,300 | $39,500 | $110,800 |
| 2020 | $3,472 | $150,300 | $39,500 | $110,800 |
| 2019 | $3,472 | $150,300 | $39,500 | $110,800 |
| 2018 | $3,261 | $131,300 | $34,400 | $96,900 |
| 2017 | $3,046 | $131,300 | $34,400 | $96,900 |
| 2016 | $2,941 | $131,300 | $34,400 | $96,900 |
| 2015 | $2,567 | $117,530 | $28,800 | $88,730 |
| 2014 | $2,658 | $117,530 | $28,800 | $88,730 |
| 2013 | -- | $117,530 | $28,800 | $88,730 |
Source: Public Records
Map
Nearby Homes