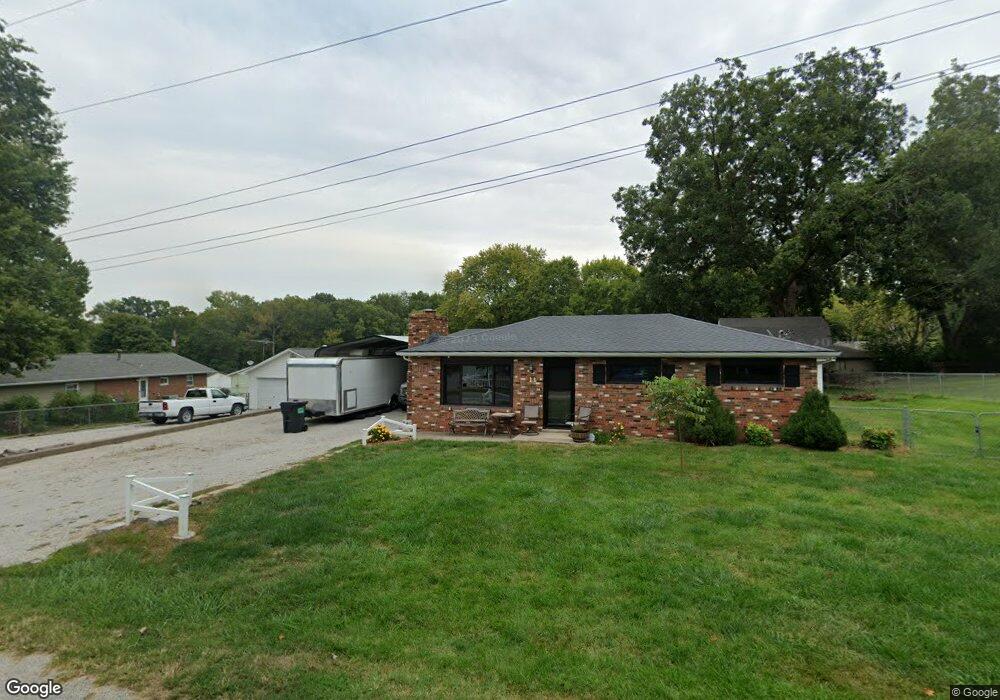
11 High Ridge Dr Caseyville, IL 62232
Estimated Value: $149,000 - $189,000
--
Bed
--
Bath
960
Sq Ft
$173/Sq Ft
Est. Value
About This Home
This home is located at 11 High Ridge Dr, Caseyville, IL 62232 and is currently estimated at $166,555, approximately $173 per square foot. 11 High Ridge Dr is a home located in St. Clair County with nearby schools including Twin Echo Elementary School, Dorris Intermediate School, and Collinsville Middle School.
Ownership History
Date
Name
Owned For
Owner Type
Purchase Details
Closed on
Oct 10, 2007
Sold by
Harris Christy Ann
Bought by
Johnson Michael R
Current Estimated Value
Home Financials for this Owner
Home Financials are based on the most recent Mortgage that was taken out on this home.
Original Mortgage
$87,500
Outstanding Balance
$15,204
Interest Rate
6.49%
Mortgage Type
Purchase Money Mortgage
Estimated Equity
$151,351
Purchase Details
Closed on
Dec 28, 2005
Sold by
Duniphan Calvin and Wierciak Teresa
Bought by
Harris Christy Ann
Home Financials for this Owner
Home Financials are based on the most recent Mortgage that was taken out on this home.
Original Mortgage
$90,000
Interest Rate
6.4%
Mortgage Type
Fannie Mae Freddie Mac
Create a Home Valuation Report for This Property
The Home Valuation Report is an in-depth analysis detailing your home's value as well as a comparison with similar homes in the area
Home Values in the Area
Average Home Value in this Area
Purchase History
| Date | Buyer | Sale Price | Title Company |
|---|---|---|---|
| Johnson Michael R | $102,500 | Freedom Title | |
| Harris Christy Ann | $120,000 | Abstracts & Titles Inc |
Source: Public Records
Mortgage History
| Date | Status | Borrower | Loan Amount |
|---|---|---|---|
| Open | Johnson Michael R | $87,500 | |
| Previous Owner | Harris Christy Ann | $90,000 |
Source: Public Records
Tax History Compared to Growth
Tax History
| Year | Tax Paid | Tax Assessment Tax Assessment Total Assessment is a certain percentage of the fair market value that is determined by local assessors to be the total taxable value of land and additions on the property. | Land | Improvement |
|---|---|---|---|---|
| 2024 | $1,112 | $40,354 | $2,449 | $37,905 |
| 2023 | $1,157 | $35,705 | $2,167 | $33,538 |
| 2022 | $1,147 | $32,537 | $2,125 | $30,412 |
| 2021 | $2,029 | $30,882 | $2,017 | $28,865 |
| 2020 | $2,003 | $29,253 | $1,910 | $27,343 |
| 2019 | $1,950 | $29,253 | $1,910 | $27,343 |
| 2018 | $1,790 | $26,633 | $2,042 | $24,591 |
| 2017 | $1,349 | $25,553 | $1,959 | $23,594 |
| 2016 | $1,354 | $24,976 | $1,915 | $23,061 |
| 2014 | $1,126 | $27,969 | $3,909 | $24,060 |
| 2013 | $1,261 | $28,485 | $3,981 | $24,504 |
Source: Public Records
Map
Nearby Homes
- 124 Long Branch Ln
- 678 Prato Ct
- 1909 Windcrest Dr
- 690 Vinci Dr
- 1821 Orr Ln
- 1128 Pisa Dr
- 28 Geneva Dr
- 238 Mill St
- 216 S Chestnut St
- 404 E Church St
- 1012 Crooked Stick Dr
- 110 E Church St
- 921 Prospect St
- 6430 Lebanon Rd
- 121 S Seminary St
- 919 Vine St
- 0 Walker Meadows Subdivision
- 0 Boreal Ridge Subdivision
- 7978 Boreal Ridge
- 107 Bethel Mine Rd
- 9 High Ridge Dr
- 10 Eberhart Dr
- 321 Bethel Meadows Rd
- 319 Bethel Meadows Rd
- 12 High Ridge Dr
- 7 High Ridge Dr
- 8 High Ridge Dr
- 2 Eberhart Dr
- 16 Eberhart Dr
- 317 Bethel Meadows Rd
- 11 Eberhart Dr
- 5 High Ridge Dr
- 7 Eberhart Dr
- 322 Bethel Meadows Rd
- 3 High Ridge Dr
- 1 Pleasant View Place
- 6 High Ridge Dr
- 20 Eberhart Dr
- 320 Bethel Meadows Rd
- 1 High Ridge Dr