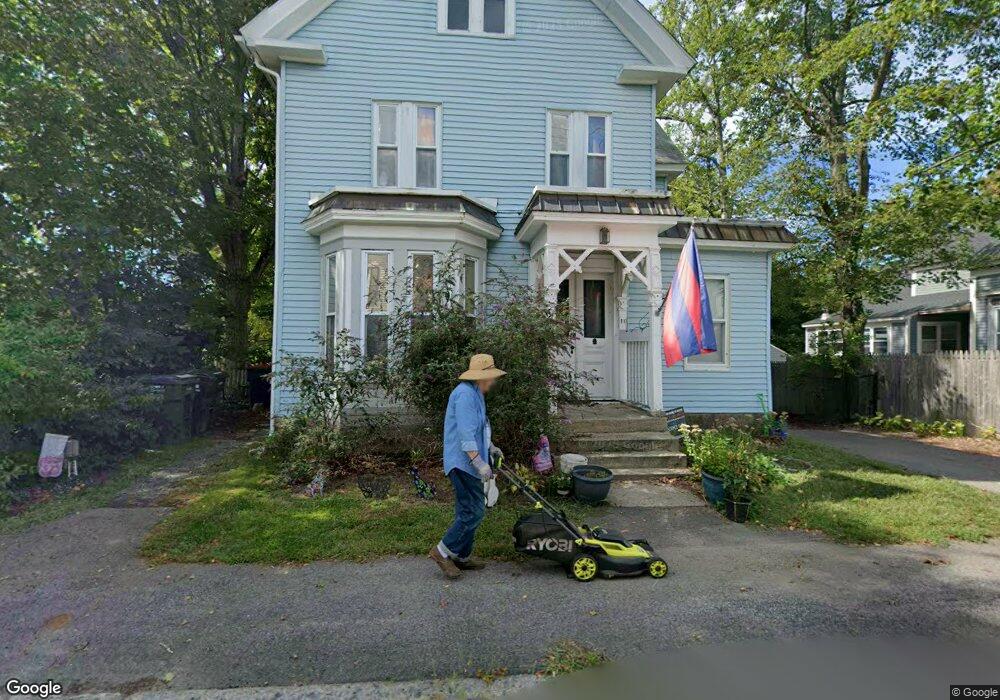
11 High St Unit A Pepperell, MA 01463
Estimated Value: $549,000 - $1,990,395
2
Beds
1
Bath
1,213
Sq Ft
$758/Sq Ft
Est. Value
About This Home
This home is located at 11 High St Unit A, Pepperell, MA 01463 and is currently estimated at $919,349, approximately $757 per square foot. 11 High St Unit A is a home located in Middlesex County with nearby schools including North Middlesex Regional High School, Pepperell Christian Academy, and Maple Dene & Moppet School.
Ownership History
Date
Name
Owned For
Owner Type
Purchase Details
Closed on
Jul 9, 2019
Sold by
Margaret Milmoe Irt
Bought by
Campbell Jonathan and Reavey Heather A
Current Estimated Value
Home Financials for this Owner
Home Financials are based on the most recent Mortgage that was taken out on this home.
Original Mortgage
$1,000,000
Outstanding Balance
$877,526
Interest Rate
3.9%
Mortgage Type
Purchase Money Mortgage
Estimated Equity
$41,823
Purchase Details
Closed on
Aug 7, 2012
Sold by
Harrison John and Harrison Bryce
Bought by
Campbell Jonathan and Campbell April M
Home Financials for this Owner
Home Financials are based on the most recent Mortgage that was taken out on this home.
Original Mortgage
$181,623
Interest Rate
3.7%
Mortgage Type
New Conventional
Purchase Details
Closed on
Jun 1, 2010
Sold by
Harrison Helene A
Bought by
Harrison John and Harrison Bryce
Purchase Details
Closed on
Sep 1, 2009
Sold by
Fnma
Bought by
Harrison Helene A
Purchase Details
Closed on
Aug 5, 2009
Sold by
Rand Scott A
Bought by
Federal National Mortgage Association
Purchase Details
Closed on
Oct 2, 2003
Sold by
Foster Lewis A and Foster Sally Ann
Bought by
Haag Gregory J and Haag Louann
Home Financials for this Owner
Home Financials are based on the most recent Mortgage that was taken out on this home.
Original Mortgage
$250,200
Interest Rate
6.25%
Mortgage Type
Purchase Money Mortgage
Purchase Details
Closed on
Dec 13, 1996
Sold by
Foster Lewis A and Foster Sally A
Bought by
Haag Gregory J and Haag Louann
Create a Home Valuation Report for This Property
The Home Valuation Report is an in-depth analysis detailing your home's value as well as a comparison with similar homes in the area
Home Values in the Area
Average Home Value in this Area
Purchase History
| Date | Buyer | Sale Price | Title Company |
|---|---|---|---|
| Campbell Jonathan | $1,250,000 | -- | |
| Campbell Jonathan | $189,000 | -- | |
| Harrison John | $115,000 | -- | |
| Harrison Helene A | $114,900 | -- | |
| Federal National Mortgage Association | $217,917 | -- | |
| Haag Gregory J | $278,000 | -- | |
| Haag Gregory J | $111,000 | -- |
Source: Public Records
Mortgage History
| Date | Status | Borrower | Loan Amount |
|---|---|---|---|
| Open | Campbell Jonathan | $1,000,000 | |
| Previous Owner | Campbell Jonathan | $181,623 | |
| Previous Owner | Haag Gregory J | $250,200 | |
| Previous Owner | Haag Gregory J | $135,000 | |
| Previous Owner | Haag Gregory J | $118,500 |
Source: Public Records
Tax History
| Year | Tax Paid | Tax Assessment Tax Assessment Total Assessment is a certain percentage of the fair market value that is determined by local assessors to be the total taxable value of land and additions on the property. | Land | Improvement |
|---|---|---|---|---|
| 2025 | $6,205 | $424,100 | $122,700 | $301,400 |
| 2024 | $5,762 | $401,500 | $111,100 | $290,400 |
| 2023 | $5,794 | $382,700 | $111,100 | $271,600 |
| 2022 | $5,888 | $343,300 | $99,400 | $243,900 |
| 2021 | $5,657 | $315,700 | $87,700 | $228,000 |
| 2020 | $5,361 | $315,700 | $87,700 | $228,000 |
| 2019 | $5,023 | $302,800 | $87,700 | $215,100 |
| 2018 | $4,922 | $300,300 | $87,700 | $212,600 |
| 2017 | $4,921 | $288,000 | $81,800 | $206,200 |
| 2016 | $4,341 | $262,600 | $81,800 | $180,800 |
| 2015 | $4,188 | $262,600 | $81,800 | $180,800 |
| 2014 | $4,063 | $256,200 | $81,800 | $174,400 |
Source: Public Records
Map
Nearby Homes
- 10 Bennett St
- 38 River Rd Unit 11
- 28-30 Groton St
- 39 Hollis St Unit A
- 29 Tarbell St
- 38 Tarbell St Unit 5B
- 38 Tarbell St Unit 1D
- 114 Groton St
- 14 Brookline St
- 33 Overlook Dr
- 208 North St
- 179 Wyman Rd
- 39 Mount Lebanon St
- 1 Nashua Rd
- 20 A Legacy Ln Unit 20A
- 24 Unkety Brook Way
- 109 Townsend St
- 120 Townsend St Unit 1
- 120 Townsend St Unit 2
- 18 Maple St Unit 14
Your Personal Tour Guide
Ask me questions while you tour the home.