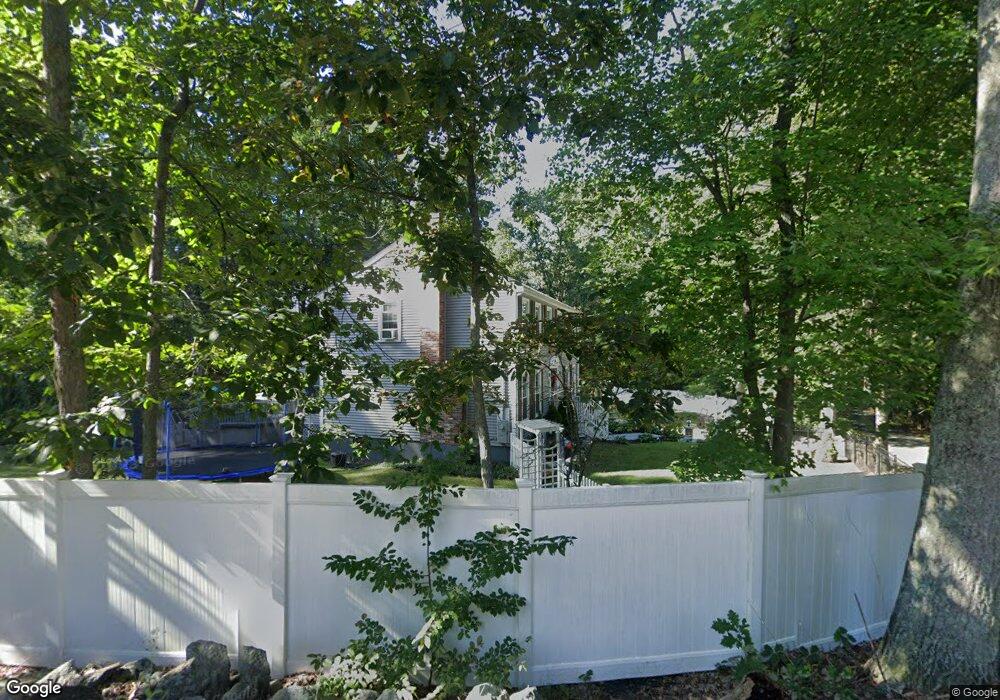
11 Hill St Medway, MA 02053
Estimated Value: $716,000 - $809,000
4
Beds
3
Baths
2,097
Sq Ft
$363/Sq Ft
Est. Value
About This Home
This home is located at 11 Hill St, Medway, MA 02053 and is currently estimated at $760,320, approximately $362 per square foot. 11 Hill St is a home located in Norfolk County with nearby schools including John D. McGovern Elementary School, Burke-Memorial Elementary, and Medway Middle School.
Ownership History
Date
Name
Owned For
Owner Type
Purchase Details
Closed on
Jun 6, 2007
Sold by
Beard Leigh F and Beard Simon B
Bought by
Mccarthy John and Mccarthy Kerry
Current Estimated Value
Home Financials for this Owner
Home Financials are based on the most recent Mortgage that was taken out on this home.
Original Mortgage
$281,250
Outstanding Balance
$171,909
Interest Rate
6.17%
Mortgage Type
Purchase Money Mortgage
Estimated Equity
$588,411
Purchase Details
Closed on
Jun 27, 1997
Sold by
Northrup Charles J and Northrup Dalene S
Bought by
Beard Simon B and Beard Leigh F
Purchase Details
Closed on
May 17, 1993
Sold by
Hanshus Jon A and Hanshus Peggy G
Bought by
Northrup Charles J and Northrup Dalene S
Create a Home Valuation Report for This Property
The Home Valuation Report is an in-depth analysis detailing your home's value as well as a comparison with similar homes in the area
Home Values in the Area
Average Home Value in this Area
Purchase History
| Date | Buyer | Sale Price | Title Company |
|---|---|---|---|
| Mccarthy John | $375,000 | -- | |
| Beard Simon B | $220,500 | -- | |
| Northrup Charles J | $200,000 | -- |
Source: Public Records
Mortgage History
| Date | Status | Borrower | Loan Amount |
|---|---|---|---|
| Open | Mccarthy John | $281,250 | |
| Closed | Mccarthy John | $56,250 | |
| Previous Owner | Northrup Charles J | $250,000 | |
| Previous Owner | Northrup Charles J | $191,000 |
Source: Public Records
Tax History Compared to Growth
Tax History
| Year | Tax Paid | Tax Assessment Tax Assessment Total Assessment is a certain percentage of the fair market value that is determined by local assessors to be the total taxable value of land and additions on the property. | Land | Improvement |
|---|---|---|---|---|
| 2025 | $8,426 | $591,300 | $322,800 | $268,500 |
| 2024 | $8,515 | $591,300 | $322,800 | $268,500 |
| 2023 | $8,464 | $531,000 | $293,800 | $237,200 |
| 2022 | $7,444 | $439,700 | $217,300 | $222,400 |
| 2021 | $7,426 | $425,300 | $202,800 | $222,500 |
| 2020 | $7,285 | $416,300 | $202,800 | $213,500 |
| 2019 | $6,798 | $400,600 | $194,500 | $206,100 |
| 2018 | $6,833 | $386,900 | $186,200 | $200,700 |
| 2017 | $6,795 | $379,200 | $182,100 | $197,100 |
| 2016 | $6,605 | $364,700 | $167,600 | $197,100 |
| 2015 | $6,422 | $352,100 | $165,500 | $186,600 |
| 2014 | $6,392 | $339,300 | $165,500 | $173,800 |
Source: Public Records
Map
Nearby Homes
- 7 Hill St
- 0 Hill St
- 116 Winthrop St
- 625 Norfolk St
- 19 Sycamore Way Unit L40
- 30 Broken Tree Rd
- 140 Goulding St
- 266 Willowgate Rise
- 1 Walnut Ln
- 1 Jameson Dr Unit 1
- 3 Jameson Dr Unit 3
- 12 Longmeadow Ln
- 154 Union St
- 1037 Washington St
- 156 Mitchell Rd
- 27 Richardson Dr Unit 27
- 36 Lovering St
- 73 Orchard St
- 12 Lovering St
- 14 Heritage Dr