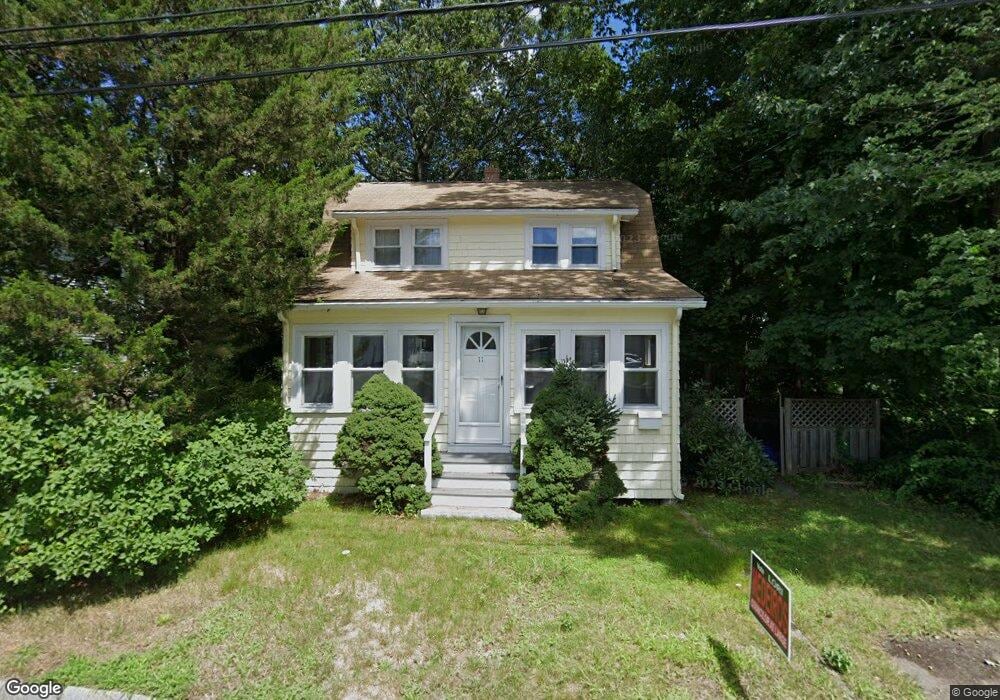
11 Hinston Rd Woburn, MA 01801
Mishawum NeighborhoodEstimated Value: $652,558 - $781,000
3
Beds
1
Bath
1,664
Sq Ft
$436/Sq Ft
Est. Value
About This Home
This home is located at 11 Hinston Rd, Woburn, MA 01801 and is currently estimated at $726,140, approximately $436 per square foot. 11 Hinston Rd is a home located in Middlesex County with nearby schools including Malcolm White Elementary School, John F. Kennedy Middle School, and Woburn High School.
Ownership History
Date
Name
Owned For
Owner Type
Purchase Details
Closed on
Aug 15, 1996
Sold by
Maillett Alan R and Maillett Janet
Bought by
Weiss Lisa L
Current Estimated Value
Home Financials for this Owner
Home Financials are based on the most recent Mortgage that was taken out on this home.
Original Mortgage
$104,900
Outstanding Balance
$8,197
Interest Rate
8.08%
Mortgage Type
Purchase Money Mortgage
Estimated Equity
$717,943
Create a Home Valuation Report for This Property
The Home Valuation Report is an in-depth analysis detailing your home's value as well as a comparison with similar homes in the area
Home Values in the Area
Average Home Value in this Area
Purchase History
| Date | Buyer | Sale Price | Title Company |
|---|---|---|---|
| Weiss Lisa L | $139,900 | -- |
Source: Public Records
Mortgage History
| Date | Status | Borrower | Loan Amount |
|---|---|---|---|
| Open | Weiss Lisa L | $104,900 | |
| Previous Owner | Weiss Lisa L | $100,000 |
Source: Public Records
Tax History Compared to Growth
Tax History
| Year | Tax Paid | Tax Assessment Tax Assessment Total Assessment is a certain percentage of the fair market value that is determined by local assessors to be the total taxable value of land and additions on the property. | Land | Improvement |
|---|---|---|---|---|
| 2025 | $4,957 | $580,400 | $300,700 | $279,700 |
| 2024 | $4,402 | $546,200 | $286,400 | $259,800 |
| 2023 | $4,422 | $508,300 | $260,400 | $247,900 |
| 2022 | $4,232 | $453,100 | $226,400 | $226,700 |
| 2021 | $3,879 | $415,800 | $215,600 | $200,200 |
| 2020 | $3,863 | $414,500 | $215,600 | $198,900 |
| 2019 | $3,777 | $397,600 | $205,300 | $192,300 |
| 2018 | $3,590 | $363,000 | $188,400 | $174,600 |
| 2017 | $3,400 | $342,100 | $179,400 | $162,700 |
| 2016 | $3,240 | $322,400 | $167,700 | $154,700 |
| 2015 | $3,113 | $306,100 | $156,700 | $149,400 |
| 2014 | $3,031 | $290,300 | $156,700 | $133,600 |
Source: Public Records
Map
Nearby Homes
- 52 Middle St
- 74 Beach St Unit 6-12
- 74 Beach St Unit 3
- 38 Middle St
- 4 Maywood Terrace
- 0 Fryeburg Rd
- 3 Highet Ave
- 295 Salem St Unit 69
- 12 Mishawum Rd
- 8 Clinton St
- 6 Callahan Dr
- 1 Boline Place
- 18 Carmen Terrace
- 602 Main St Unit 1
- 14 Church Ave
- 14 Church Ave Unit 2
- 9 Wade Ave
- 104 Forest Park Rd
- 18 Gardner Ave
- 20 Barbara Cir