11 Hobart St Unit 13 Braintree, MA 02184
East Braintree NeighborhoodEstimated Value: $573,000 - $802,000
4
Beds
2
Baths
2,084
Sq Ft
$337/Sq Ft
Est. Value
About This Home
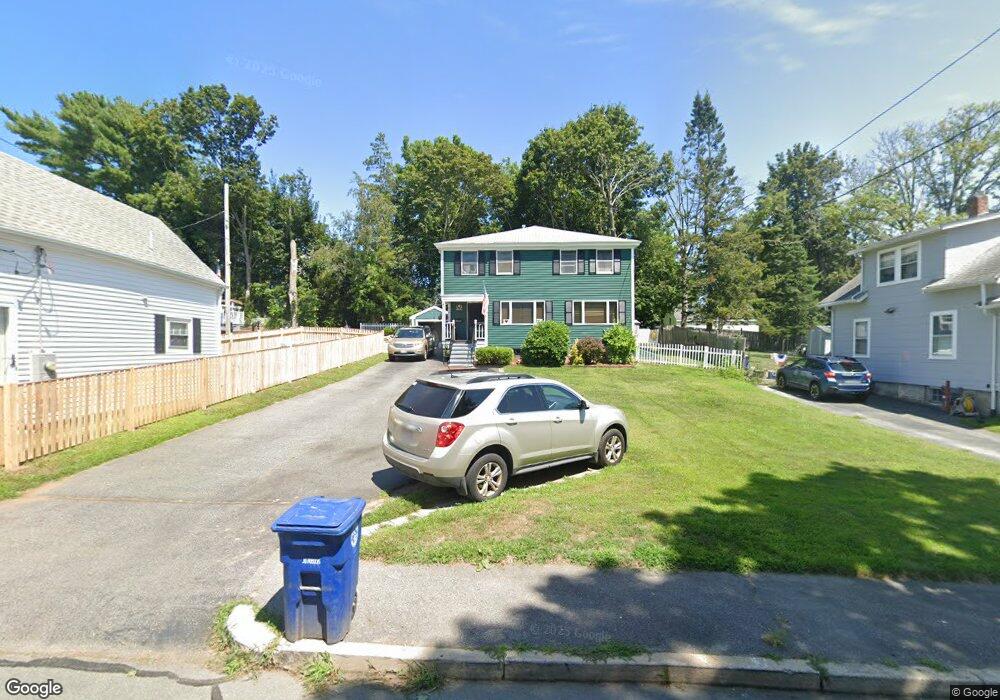
This home is located at 11 Hobart St Unit 13, Braintree, MA 02184 and is currently estimated at $701,381, approximately $336 per square foot. 11 Hobart St Unit 13 is a home located in Norfolk County with nearby schools including Braintree High School, Sacred Heart Elementary School, and South Shore Christian Academy.
Ownership History
Date
Name
Owned For
Owner Type
Purchase Details
Closed on
May 24, 1974
Bought by
Riordon John B and Riordon Elaine B
Current Estimated Value
Create a Home Valuation Report for This Property
The Home Valuation Report is an in-depth analysis detailing your home's value as well as a comparison with similar homes in the area
Home Values in the Area
Average Home Value in this Area
Purchase History
| Date | Buyer | Sale Price | Title Company |
|---|---|---|---|
| Riordon John B | -- | -- |
Source: Public Records
Mortgage History
| Date | Status | Borrower | Loan Amount |
|---|---|---|---|
| Open | Riordon John B | $100,000 | |
| Closed | Riordon John B | $50,000 |
Source: Public Records
Tax History Compared to Growth
Tax History
| Year | Tax Paid | Tax Assessment Tax Assessment Total Assessment is a certain percentage of the fair market value that is determined by local assessors to be the total taxable value of land and additions on the property. | Land | Improvement |
|---|---|---|---|---|
| 2025 | $6,430 | $644,300 | $322,600 | $321,700 |
| 2024 | $5,873 | $619,500 | $300,800 | $318,700 |
| 2023 | $5,569 | $570,600 | $270,300 | $300,300 |
| 2022 | $5,418 | $544,500 | $244,200 | $300,300 |
| 2021 | $5,000 | $502,500 | $220,600 | $281,900 |
| 2020 | $4,630 | $469,600 | $200,600 | $269,000 |
| 2019 | $4,477 | $443,700 | $191,800 | $251,900 |
| 2018 | $4,377 | $415,300 | $174,400 | $240,900 |
| 2017 | $4,208 | $391,800 | $165,700 | $226,100 |
| 2016 | $4,176 | $380,300 | $139,500 | $240,800 |
| 2015 | $4,088 | $369,300 | $137,800 | $231,500 |
| 2014 | $3,867 | $338,600 | $125,600 | $213,000 |
Source: Public Records
Map
Nearby Homes
- 125 Allen St Unit A
- 141 Commercial St Unit 9
- 51 Faxon St
- 41 Lantern Ln
- 141 Hobart St
- 37 Lantern Ln
- 74 Magnolia St
- 159 Hobart St
- 67 Somerville Ave
- 312 Shaw St
- 9 Hillside Ave
- 124 Louise Rd
- 122 Washington St Unit 22
- 10 Skyline Dr Unit 5
- 116 Gordon Rd
- 1 Pantano St
- 11 Richmond St
- 30 Skyline Dr Unit 6
- 15 Summer St
- 298 Lisle St
- 9 Hobart St
- 21 Hobart St
- 7 Hobart St
- 23 Hobart St
- 19 Hobart St
- 14 Hobart St Unit 16
- 14 Hobart St Unit 2
- 181 Allen St
- 134 Front St
- 173 Allen St
- 27 Hobart St
- 120-122 Front St
- 18 Hobart St
- 120 Front St Unit 122
- 120 Front St Unit 2
- 122 Front St Unit 1
- 120 Front St Unit 1
- 16 Jordan Cir
- 22 Jordan Cir
- 37 Hobart St