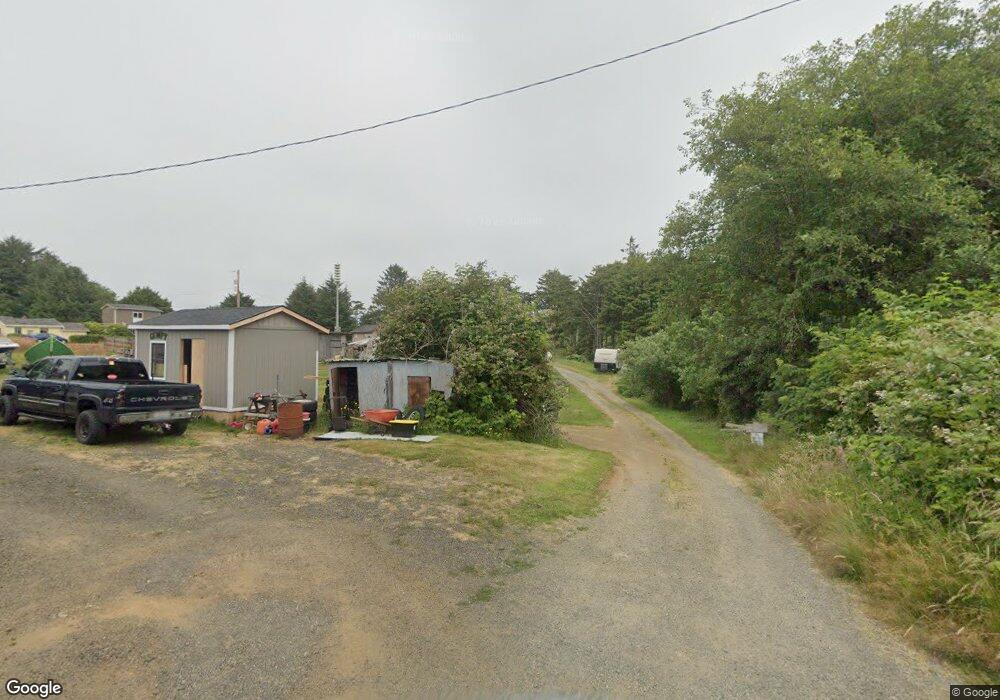
11 Hoquiam St Copalis Beach, WA 98535
Copalis Beach NeighborhoodEstimated Value: $269,000 - $315,000
3
Beds
1
Bath
1,008
Sq Ft
$292/Sq Ft
Est. Value
About This Home
This home is located at 11 Hoquiam St, Copalis Beach, WA 98535 and is currently estimated at $294,117, approximately $291 per square foot. 11 Hoquiam St is a home located in Grays Harbor County with nearby schools including North Beach Junior/Senior High School.
Ownership History
Date
Name
Owned For
Owner Type
Purchase Details
Closed on
Mar 16, 2017
Sold by
Cameron Erin M and Jurin Erin M
Bought by
Cameron Jim A and Cameron Erin N
Current Estimated Value
Home Financials for this Owner
Home Financials are based on the most recent Mortgage that was taken out on this home.
Original Mortgage
$103,785
Outstanding Balance
$86,112
Interest Rate
4.19%
Mortgage Type
FHA
Estimated Equity
$208,005
Purchase Details
Closed on
May 10, 2011
Sold by
Stone Dale E
Bought by
Jurin Erin M
Home Financials for this Owner
Home Financials are based on the most recent Mortgage that was taken out on this home.
Original Mortgage
$86,000
Interest Rate
4.63%
Mortgage Type
New Conventional
Purchase Details
Closed on
Jan 5, 2005
Sold by
Getty Janice E
Bought by
Skinas Stone Jr Dale E and Skinas Stone Demetra
Home Financials for this Owner
Home Financials are based on the most recent Mortgage that was taken out on this home.
Original Mortgage
$72,900
Interest Rate
5.69%
Mortgage Type
New Conventional
Create a Home Valuation Report for This Property
The Home Valuation Report is an in-depth analysis detailing your home's value as well as a comparison with similar homes in the area
Home Values in the Area
Average Home Value in this Area
Purchase History
| Date | Buyer | Sale Price | Title Company |
|---|---|---|---|
| Cameron Jim A | -- | Coast Title | |
| Jurin Erin M | $85,947 | Pacific Title | |
| Skinas Stone Jr Dale E | $80,673 | Grays Harbor Title |
Source: Public Records
Mortgage History
| Date | Status | Borrower | Loan Amount |
|---|---|---|---|
| Open | Cameron Jim A | $103,785 | |
| Closed | Jurin Erin M | $86,000 | |
| Previous Owner | Skinas Stone Jr Dale E | $72,900 |
Source: Public Records
Tax History Compared to Growth
Tax History
| Year | Tax Paid | Tax Assessment Tax Assessment Total Assessment is a certain percentage of the fair market value that is determined by local assessors to be the total taxable value of land and additions on the property. | Land | Improvement |
|---|---|---|---|---|
| 2025 | $1,979 | $231,425 | $55,054 | $176,371 |
| 2023 | $1,751 | $223,711 | $49,500 | $174,211 |
| 2022 | $1,464 | $150,839 | $30,000 | $120,839 |
| 2021 | $1,438 | $150,839 | $30,000 | $120,839 |
| 2020 | $1,485 | $133,650 | $30,000 | $103,650 |
| 2019 | $1,480 | $133,650 | $30,000 | $103,650 |
| 2018 | $1,545 | $132,134 | $30,000 | $102,134 |
| 2017 | $815 | $132,134 | $30,000 | $102,134 |
| 2016 | $742 | $71,850 | $16,000 | $55,850 |
| 2014 | -- | $70,685 | $16,000 | $54,685 |
| 2013 | -- | $73,465 | $20,000 | $53,465 |
Source: Public Records
Map
Nearby Homes
- 5 Hoquiam St
- 2850 Washington 109
- 3137 State Route 109
- 11 Condra Rd
- 715 Copalis Beach Rd
- 699 Copalis Beach Rd
- 23 Copalis Rv Ln
- 18 Ocean View Ln
- 5 Sequoia Place
- 15 Navaho Place
- 21 Nelson Place
- 33 Ocean Ln
- 7 Ocean Ln
- 2850 Wa-109
- 2 Dolphin Ln
- 14 Chabot Rd
- 12 Chabot Rd
- 27 Chabot Rd
- 282 Copalis Beach Rd
- 54 S Copalis Rock Ln
- 12 Aberdeen St
- 16 Aberdeen St
- 11 Aberdeen St
- 6 Aberdeen St
- 5 Aberdeen St
- 4 Aberdeen St
- 4122 Washington 109
- 3290 Washington 109
- 3935 Washington 109
- 0 Sr 109 Unit 28173775
- 0 Sr 109 Unit 28170782
- 123 Hwy 109
- 0 Washington 109
- 3 Aberdeen St
- 17 Copalis Ln
- 3092 State Route 109
- 16 Copalis Ln
- 12 Grover St
- 15 Grover St
- 10 C St