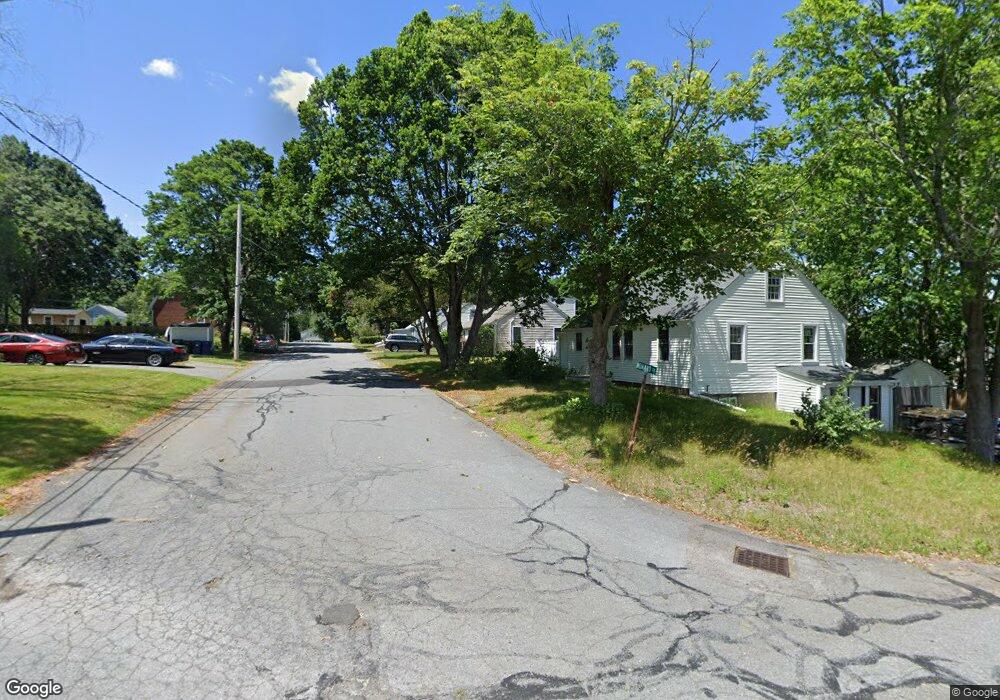
11 Howard St Bridgewater, MA 02324
Estimated Value: $462,000 - $503,683
3
Beds
2
Baths
1,428
Sq Ft
$343/Sq Ft
Est. Value
About This Home
This home is located at 11 Howard St, Bridgewater, MA 02324 and is currently estimated at $489,421, approximately $342 per square foot. 11 Howard St is a home located in Plymouth County with nearby schools including Mitchell Elementary School, Williams Intermediate School, and Bridgewater Middle School.
Ownership History
Date
Name
Owned For
Owner Type
Purchase Details
Closed on
May 20, 2005
Sold by
Hill Michael and Hill Kristy
Bought by
Murphy Joseph E
Current Estimated Value
Home Financials for this Owner
Home Financials are based on the most recent Mortgage that was taken out on this home.
Original Mortgage
$253,200
Outstanding Balance
$132,952
Interest Rate
5.95%
Mortgage Type
Purchase Money Mortgage
Estimated Equity
$356,469
Purchase Details
Closed on
Feb 28, 2001
Sold by
Perry Glenn S
Bought by
Hill Michael and Hill Kristy
Purchase Details
Closed on
Nov 1, 1999
Sold by
Jones Holly R
Bought by
Perry Glenn
Purchase Details
Closed on
Dec 1, 1993
Sold by
Crotty Melvin D and Crotty Linda M
Bought by
Jones Holly R
Purchase Details
Closed on
Nov 2, 1987
Sold by
Laycox Joseph P
Bought by
Crotty Melvin D
Create a Home Valuation Report for This Property
The Home Valuation Report is an in-depth analysis detailing your home's value as well as a comparison with similar homes in the area
Home Values in the Area
Average Home Value in this Area
Purchase History
| Date | Buyer | Sale Price | Title Company |
|---|---|---|---|
| Murphy Joseph E | $316,500 | -- | |
| Hill Michael | $175,000 | -- | |
| Perry Glenn | $135,000 | -- | |
| Jones Holly R | $106,000 | -- | |
| Crotty Melvin D | $128,000 | -- |
Source: Public Records
Mortgage History
| Date | Status | Borrower | Loan Amount |
|---|---|---|---|
| Open | Crotty Melvin D | $253,200 | |
| Closed | Crotty Melvin D | $58,300 |
Source: Public Records
Tax History Compared to Growth
Tax History
| Year | Tax Paid | Tax Assessment Tax Assessment Total Assessment is a certain percentage of the fair market value that is determined by local assessors to be the total taxable value of land and additions on the property. | Land | Improvement |
|---|---|---|---|---|
| 2025 | $4,881 | $412,600 | $161,600 | $251,000 |
| 2024 | $4,747 | $391,000 | $153,900 | $237,100 |
| 2023 | $4,902 | $381,800 | $159,800 | $222,000 |
| 2022 | $4,804 | $335,500 | $140,200 | $195,300 |
| 2021 | $4,251 | $293,600 | $118,900 | $174,700 |
| 2020 | $4,163 | $282,600 | $114,400 | $168,200 |
| 2019 | $4,326 | $274,900 | $114,400 | $160,500 |
| 2018 | $3,928 | $258,600 | $111,100 | $147,500 |
| 2017 | $3,512 | $225,000 | $111,100 | $113,900 |
| 2016 | $3,403 | $219,000 | $108,900 | $110,100 |
| 2015 | $3,342 | $205,800 | $100,100 | $105,700 |
| 2014 | $3,274 | $201,500 | $97,200 | $104,300 |
Source: Public Records
Map
Nearby Homes
- 12 Perkins St
- 128 Broad St
- Lot 3 Fontana Way
- 180 Main St Unit A15
- 60 Miranda Way
- 4 Mullen Way
- 167 Spring St
- 74 Mount Prospect St
- 10 Duck Farm Ln
- 248 Center St Unit 7
- 116 Center St
- 130 Maple Ave
- 18 Aldrich Rd
- 580 Broad St Unit 1
- 580 Broad St Unit 2
- 35 Leonard St Unit 35
- 51 Cottage St
- 398 Plymouth St
- 57 Carver Dr
- Lot 2 Fontana Way