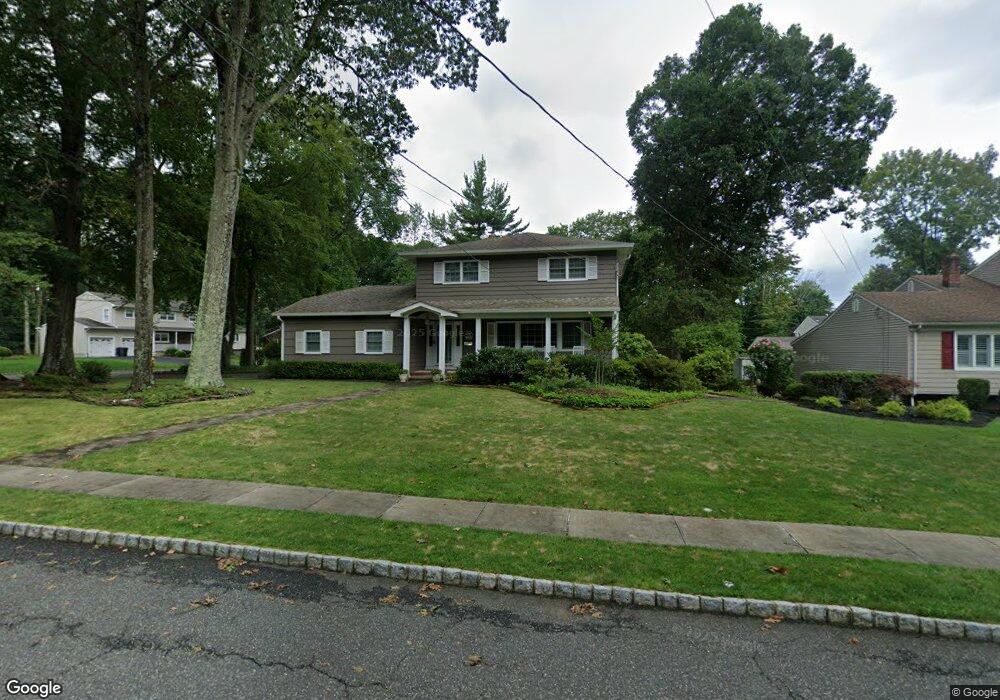
11 Howland Cir West Caldwell, NJ 07006
Estimated Value: $925,258 - $1,074,000
--
Bed
--
Bath
2,618
Sq Ft
$383/Sq Ft
Est. Value
About This Home
This home is located at 11 Howland Cir, West Caldwell, NJ 07006 and is currently estimated at $1,003,315, approximately $383 per square foot. 11 Howland Cir is a home located in Essex County with nearby schools including James Caldwell High School, Trinity Academy, and Essex Valley School.
Ownership History
Date
Name
Owned For
Owner Type
Purchase Details
Closed on
Sep 28, 2020
Sold by
Marsano Joseph and Marsano Debbie
Bought by
Gallo Ralph D and Gallo Stephanie A
Current Estimated Value
Home Financials for this Owner
Home Financials are based on the most recent Mortgage that was taken out on this home.
Original Mortgage
$643,500
Outstanding Balance
$572,359
Interest Rate
2.9%
Mortgage Type
New Conventional
Estimated Equity
$430,956
Purchase Details
Closed on
Sep 3, 2020
Sold by
Marsano Joseph and Marsano Debbie
Bought by
Gallo Ralph D and Gallo Stephanie A
Home Financials for this Owner
Home Financials are based on the most recent Mortgage that was taken out on this home.
Original Mortgage
$643,500
Outstanding Balance
$572,359
Interest Rate
2.9%
Mortgage Type
New Conventional
Estimated Equity
$430,956
Purchase Details
Closed on
Jun 6, 1988
Sold by
Mopsick Michael D
Bought by
Marsano Joseph
Create a Home Valuation Report for This Property
The Home Valuation Report is an in-depth analysis detailing your home's value as well as a comparison with similar homes in the area
Home Values in the Area
Average Home Value in this Area
Purchase History
| Date | Buyer | Sale Price | Title Company |
|---|---|---|---|
| Gallo Ralph D | $715,000 | Chicago Title | |
| Gallo Ralph D | $715,000 | All Ahead Title Agency | |
| Marsano Joseph | $372,000 | -- | |
| Marsano Joseph | $372,000 | -- |
Source: Public Records
Mortgage History
| Date | Status | Borrower | Loan Amount |
|---|---|---|---|
| Open | Gallo Ralph D | $643,500 | |
| Closed | Gallo Ralph D | $643,500 |
Source: Public Records
Tax History Compared to Growth
Tax History
| Year | Tax Paid | Tax Assessment Tax Assessment Total Assessment is a certain percentage of the fair market value that is determined by local assessors to be the total taxable value of land and additions on the property. | Land | Improvement |
|---|---|---|---|---|
| 2025 | $14,218 | $526,400 | $273,400 | $253,000 |
| 2024 | $14,218 | $526,400 | $273,400 | $253,000 |
| 2022 | $13,992 | $526,400 | $273,400 | $253,000 |
| 2021 | $13,886 | $526,400 | $273,400 | $253,000 |
| 2020 | $13,750 | $526,400 | $273,400 | $253,000 |
| 2019 | $13,581 | $526,400 | $273,400 | $253,000 |
| 2018 | $13,307 | $526,400 | $273,400 | $253,000 |
| 2017 | $13,028 | $526,400 | $273,400 | $253,000 |
| 2016 | $12,439 | $526,400 | $273,400 | $253,000 |
| 2015 | $12,286 | $526,400 | $273,400 | $253,000 |
| 2014 | $12,134 | $524,600 | $273,400 | $251,200 |
Source: Public Records
Map
Nearby Homes
- 9 Aldom Cir
- 53 Holiday Dr
- 16 Glenwood Way
- 6 Sunnie Terrace
- 8 Birkendene Rd
- 60 Richard Ave
- 22 Whitaker Place
- 31 Cleveland Rd
- 4 Ellis Rd
- 254 Runnymede Rd
- 11 Hillcrest Rd
- 5 Domessina Ln Unit E1
- 1 Domessina Ln Unit F-6
- 1 Domessina Ln Unit F8
- 8 Domessina Ln Unit C1
- 4 Domessina Ln
- 4 Domessina Ln Unit D1
- 26 Ravine Ave