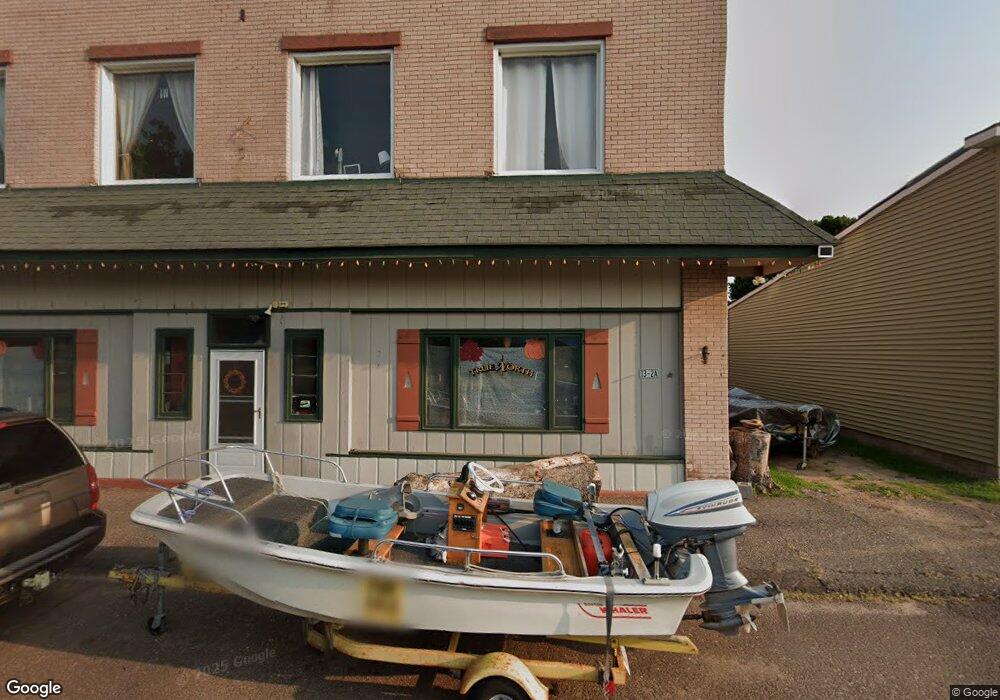
11 Hubbell St Ahmeek, MI 49901
Estimated Value: $49,000 - $167,000
--
Bed
1
Bath
2,108
Sq Ft
$51/Sq Ft
Est. Value
About This Home
This home is located at 11 Hubbell St, Ahmeek, MI 49901 and is currently estimated at $107,925, approximately $51 per square foot. 11 Hubbell St is a home with nearby schools including C.L.K. Elementary School, Washington Middle School, and Horizons Alternative High School.
Create a Home Valuation Report for This Property
The Home Valuation Report is an in-depth analysis detailing your home's value as well as a comparison with similar homes in the area
Home Values in the Area
Average Home Value in this Area
Tax History Compared to Growth
Tax History
| Year | Tax Paid | Tax Assessment Tax Assessment Total Assessment is a certain percentage of the fair market value that is determined by local assessors to be the total taxable value of land and additions on the property. | Land | Improvement |
|---|---|---|---|---|
| 2025 | $737 | $22,098 | $2,575 | $19,523 |
| 2024 | -- | $19,665 | $1,626 | $18,039 |
| 2023 | -- | $16,265 | $949 | $15,316 |
| 2022 | -- | $14,836 | $949 | $13,887 |
| 2021 | -- | $16,113 | $949 | $15,164 |
| 2020 | -- | -- | $949 | $14,771 |
| 2019 | -- | -- | $31 | $24,803 |
| 2018 | -- | -- | $31 | $19,952 |
| 2017 | -- | -- | $750 | $19,091 |
| 2016 | -- | -- | $750 | $17,714 |
| 2015 | -- | -- | $750 | $16,709 |
| 2014 | -- | -- | $750 | $18,079 |
| 2013 | -- | -- | $750 | $17,744 |
Source: Public Records
Map
Nearby Homes
- TBD Lots 3 & 4 Duncan St
- 45 Senter St
- 52 Senter St
- 213 Seneca St
- 304 Gratiot St
- 392 7th St
- 152 Birch St
- 35 Union St
- TBD (Sec 22) US Highway 41
- 1021 Sedar Hill(parcel C) Rd Unit Parcel C
- 1021 Sedar Hill(parcel D) Rd Unit (Parcel D)
- TBD Michigan 203
- 230 Seneca St
- 806 Pine St
- 114 Ahmeek St
- 51 1st St
- 25417 Elm St
- 56937 Hecla St
- 137 Kearsarge St
- 25220 Maple St