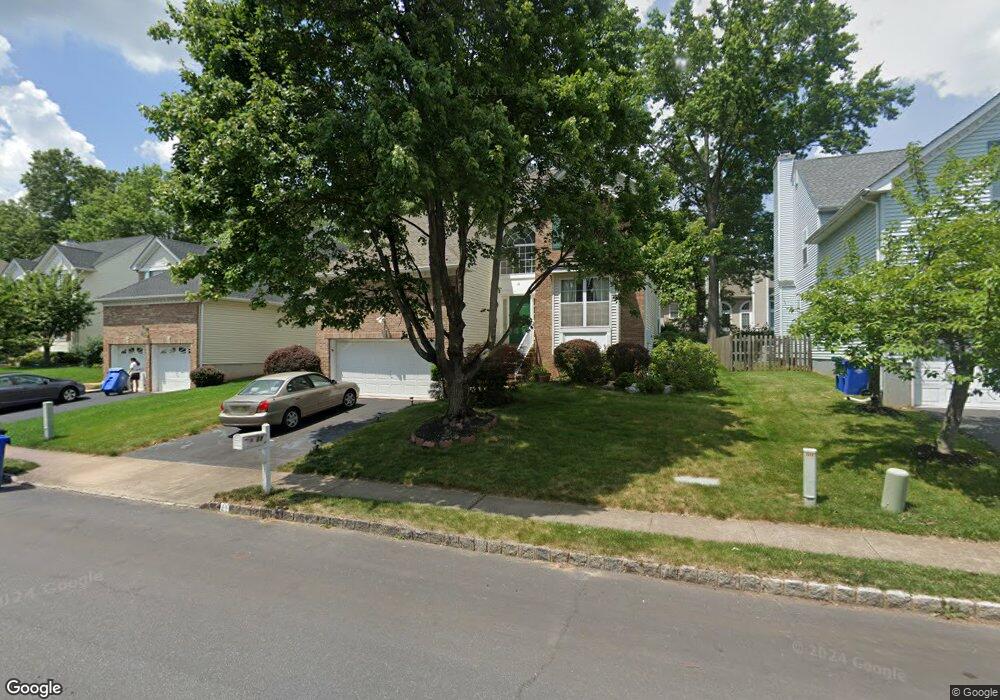
11 Huntley Way Bridgewater, NJ 08807
Estimated Value: $758,000 - $880,000
--
Bed
--
Bath
2,091
Sq Ft
$390/Sq Ft
Est. Value
About This Home
This home is located at 11 Huntley Way, Bridgewater, NJ 08807 and is currently estimated at $815,953, approximately $390 per square foot. 11 Huntley Way is a home located in Somerset County with nearby schools including Bradley Gardens Primary School, Eisenhower Intermediate School, and Bridgewater-Raritan Middle School.
Ownership History
Date
Name
Owned For
Owner Type
Purchase Details
Closed on
Mar 28, 2007
Sold by
Sirva Relocation Credit Llc
Bought by
He Shaojun and Zhou Qing
Current Estimated Value
Home Financials for this Owner
Home Financials are based on the most recent Mortgage that was taken out on this home.
Original Mortgage
$330,000
Outstanding Balance
$43,776
Interest Rate
6.33%
Mortgage Type
Purchase Money Mortgage
Estimated Equity
$772,177
Purchase Details
Closed on
Aug 31, 2006
Sold by
Huang Shing Jen and Zhou Kenwin
Bought by
Sirva Relocation Credit Llc
Purchase Details
Closed on
Aug 13, 1996
Sold by
Country Walk Deve
Bought by
El Hadidi Tarek and El Hadidi Maria
Home Financials for this Owner
Home Financials are based on the most recent Mortgage that was taken out on this home.
Original Mortgage
$200,000
Interest Rate
8.08%
Create a Home Valuation Report for This Property
The Home Valuation Report is an in-depth analysis detailing your home's value as well as a comparison with similar homes in the area
Home Values in the Area
Average Home Value in this Area
Purchase History
| Date | Buyer | Sale Price | Title Company |
|---|---|---|---|
| He Shaojun | $495,000 | Stewart Title Guaranty Compa | |
| Sirva Relocation Credit Llc | $530,000 | Stewart Title Guaranty Compa | |
| El Hadidi Tarek | $221,853 | -- |
Source: Public Records
Mortgage History
| Date | Status | Borrower | Loan Amount |
|---|---|---|---|
| Open | He Shaojun | $330,000 | |
| Previous Owner | El Hadidi Tarek | $200,000 |
Source: Public Records
Tax History Compared to Growth
Tax History
| Year | Tax Paid | Tax Assessment Tax Assessment Total Assessment is a certain percentage of the fair market value that is determined by local assessors to be the total taxable value of land and additions on the property. | Land | Improvement |
|---|---|---|---|---|
| 2025 | $12,736 | $661,500 | $286,900 | $374,600 |
| 2024 | $12,736 | $652,800 | $286,900 | $365,900 |
| 2023 | $11,960 | $602,500 | $286,900 | $315,600 |
| 2022 | $11,238 | $547,400 | $276,900 | $270,500 |
| 2021 | $11,159 | $531,900 | $276,900 | $255,000 |
| 2020 | $11,067 | $528,500 | $276,900 | $251,600 |
| 2019 | $11,068 | $523,300 | $276,900 | $246,400 |
| 2018 | $10,932 | $518,100 | $276,900 | $241,200 |
| 2017 | $10,659 | $504,700 | $266,900 | $237,800 |
| 2016 | $10,484 | $503,800 | $266,900 | $236,900 |
| 2015 | $10,444 | $502,100 | $266,900 | $235,200 |
| 2014 | $10,053 | $476,000 | $266,900 | $209,100 |
Source: Public Records
Map
Nearby Homes
- 4101 Dilts Ln
- 4703 Patterson St Unit 47
- 48 Reinhart Way
- 19 Craft Farm Dr
- 2008 Ackmen Ct
- 507 Dunn Cir
- 405 Porter Way W
- 501 Reading Cir
- 2104 Doolittle Dr
- 2706 Pinhorn Dr
- 2103 Vroom Dr
- 67 Shaffer Rd
- 43 Wexford Way
- 3803 Vroom Dr
- 3214 Winder Dr
- 3705 Vroom Dr Unit 3705
- 2507 Vroom Dr
- 3010 Doolittle Dr
- 2801 Doolittle Dr
- 2512 Lindsley Rd
- 15 Huntley Way
- 9 Huntley Way
- 2604 Johnson Cir
- 2603 Johnson Cir
- 17 Huntley Way
- 7 Huntley Way
- 2605 Johnson Cir Unit 26E
- 2602 Johnson Cir
- 2606 Johnson Cir
- 2601 Johnson Cir Unit 6
- 2601 Johnson Cir Unit 26A
- 18 Huntley Way
- 19 Huntley Way
- 5 Huntley Way
- 22 Huntley Way
- 2501 Johnson Cir
- 2707 Johnson Cir Unit 27G
- 2502 Johnson Cir Unit 25B
- 20 Woodward Dr
- 24 Huntley Way