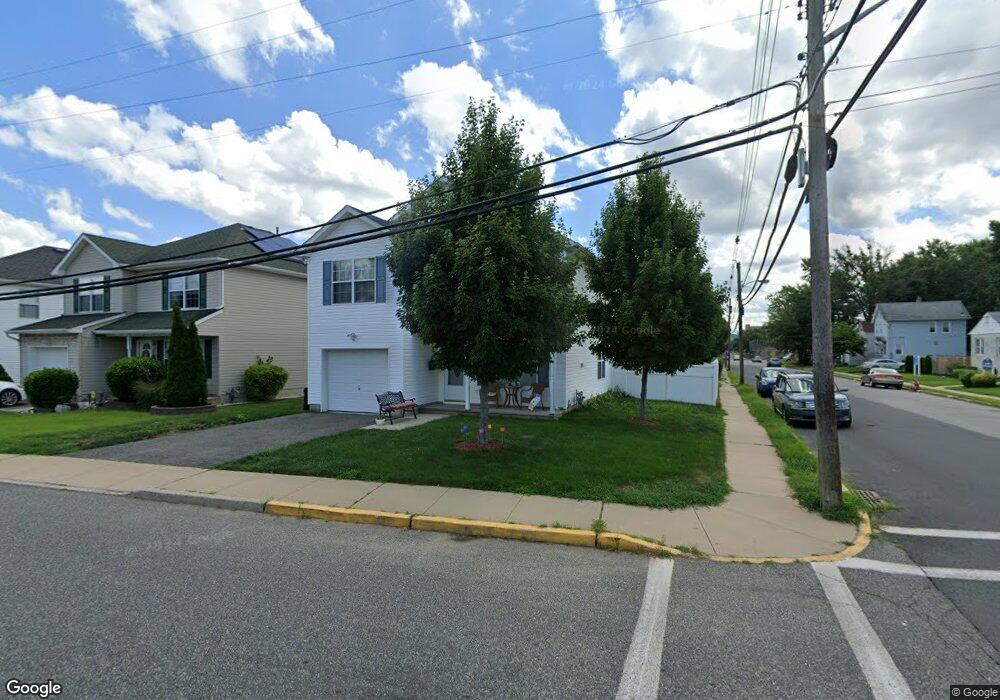
11 Hurley St Keyport, NJ 07735
Estimated Value: $584,000 - $664,000
4
Beds
3
Baths
1,925
Sq Ft
$330/Sq Ft
Est. Value
About This Home
This home is located at 11 Hurley St, Keyport, NJ 07735 and is currently estimated at $636,073, approximately $330 per square foot. 11 Hurley St is a home located in Monmouth County with nearby schools including Keyport Central School, Keyport High School, and Icob Academy.
Ownership History
Date
Name
Owned For
Owner Type
Purchase Details
Closed on
Jun 25, 2015
Sold by
Yeboah Afihene Kwasi and Brobbey Vivian
Bought by
Montemarano Christopher
Current Estimated Value
Home Financials for this Owner
Home Financials are based on the most recent Mortgage that was taken out on this home.
Original Mortgage
$281,801
Outstanding Balance
$222,085
Interest Rate
4.25%
Mortgage Type
FHA
Estimated Equity
$413,988
Purchase Details
Closed on
Apr 24, 2003
Sold by
Devino Robert
Bought by
Afihene Kwasi Yeboah and Brobbey Vivian
Home Financials for this Owner
Home Financials are based on the most recent Mortgage that was taken out on this home.
Original Mortgage
$214,400
Interest Rate
5.93%
Create a Home Valuation Report for This Property
The Home Valuation Report is an in-depth analysis detailing your home's value as well as a comparison with similar homes in the area
Home Values in the Area
Average Home Value in this Area
Purchase History
| Date | Buyer | Sale Price | Title Company |
|---|---|---|---|
| Montemarano Christopher | $287,000 | First American Title | |
| Afihene Kwasi Yeboah | $268,000 | -- |
Source: Public Records
Mortgage History
| Date | Status | Borrower | Loan Amount |
|---|---|---|---|
| Open | Montemarano Christopher | $281,801 | |
| Previous Owner | Afihene Kwasi Yeboah | $214,400 |
Source: Public Records
Tax History Compared to Growth
Tax History
| Year | Tax Paid | Tax Assessment Tax Assessment Total Assessment is a certain percentage of the fair market value that is determined by local assessors to be the total taxable value of land and additions on the property. | Land | Improvement |
|---|---|---|---|---|
| 2025 | $10,758 | $559,600 | $157,900 | $401,700 |
| 2024 | $10,695 | $519,700 | $137,800 | $381,900 |
| 2023 | $10,695 | $486,600 | $131,200 | $355,400 |
| 2022 | $8,778 | $440,200 | $131,200 | $309,000 |
| 2021 | $8,778 | $347,800 | $121,500 | $226,300 |
| 2020 | $8,468 | $333,000 | $112,500 | $220,500 |
| 2019 | $8,285 | $326,300 | $108,300 | $218,000 |
| 2018 | $7,990 | $307,300 | $122,500 | $184,800 |
| 2017 | $7,560 | $290,000 | $117,800 | $172,200 |
| 2016 | $8,163 | $315,800 | $117,800 | $198,000 |
| 2015 | $7,820 | $301,100 | $103,500 | $197,600 |
| 2014 | $7,137 | $277,500 | $84,000 | $193,500 |
Source: Public Records
Map
Nearby Homes
- 195 Atlantic St
- 25-27 Brook Ave
- 231 Atlantic St Unit 23
- 226 Osborn St
- 72 Manchester Ave
- 74 Manchester Ave
- 69 Maple Place
- 9 Monmouth Place
- 50 State Route 36
- 2108 Florence Ave
- 40 Church St
- 73 2nd St
- 162 2nd St
- 128 1st St
- 142 2nd St
- 55 E Front St
- 90 Saint Peters Place
- 37 Myrtle Ave
- 18 Pine St
- 3 Julia Ln
- 11 Hurley St Unit 4
- 11 Hurley St Unit 3
- 11-1 Hurley St
- 11-2 Hurley St
- 217 Atlantic St
- 11-3 Hurley St
- 9 Hurley St
- 219 Atlantic St
- 285 Church St
- 11-4 Hurley St
- 36 Van Dorn St
- 221 Atlantic St
- 213 Atlantic St
- 38 Van Dorn St
- 218 Atlantic St
- 11-5 Hurley St
- 7 Hurley St
- 264 Hurley St
- 212 Atlantic St
- 4 Van Dorn St Unit 4A