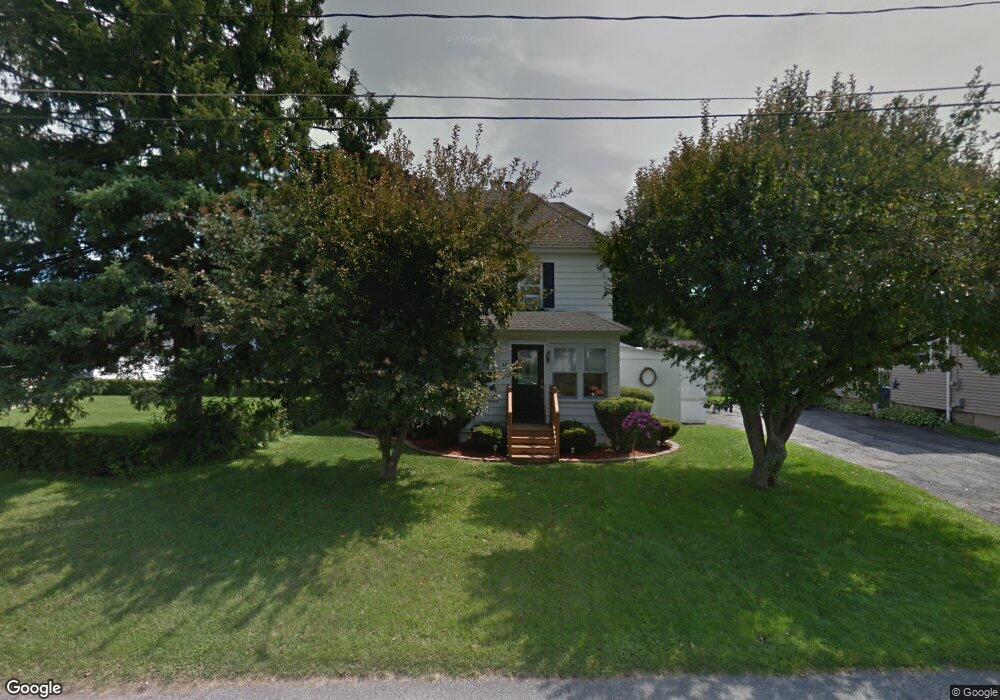
11 Huron St Pittsfield, MA 01201
Estimated Value: $260,000 - $350,000
2
Beds
2
Baths
1,642
Sq Ft
$184/Sq Ft
Est. Value
About This Home
This home is located at 11 Huron St, Pittsfield, MA 01201 and is currently estimated at $301,867, approximately $183 per square foot. 11 Huron St is a home located in Berkshire County with nearby schools including Egremont Elementary School, Theodore Herberg Middle School, and Pittsfield High School.
Ownership History
Date
Name
Owned For
Owner Type
Purchase Details
Closed on
Jul 7, 2009
Sold by
Blake Ronald J and Blake Jennifer A
Bought by
Blake Ronald J and Blake Jennifer A
Current Estimated Value
Home Financials for this Owner
Home Financials are based on the most recent Mortgage that was taken out on this home.
Original Mortgage
$82,000
Outstanding Balance
$52,281
Interest Rate
4.86%
Mortgage Type
Purchase Money Mortgage
Estimated Equity
$249,586
Purchase Details
Closed on
Mar 17, 2000
Sold by
Bruni Eileen M and Reddy Rosemary A
Bought by
Blake Ronald J
Home Financials for this Owner
Home Financials are based on the most recent Mortgage that was taken out on this home.
Original Mortgage
$70,775
Interest Rate
8.24%
Mortgage Type
Purchase Money Mortgage
Create a Home Valuation Report for This Property
The Home Valuation Report is an in-depth analysis detailing your home's value as well as a comparison with similar homes in the area
Home Values in the Area
Average Home Value in this Area
Purchase History
| Date | Buyer | Sale Price | Title Company |
|---|---|---|---|
| Blake Ronald J | -- | -- | |
| Blake Ronald J | -- | -- | |
| Blake Ronald J | -- | -- | |
| Blake Ronald J | $74,500 | -- | |
| Blake Ronald J | $74,500 | -- |
Source: Public Records
Mortgage History
| Date | Status | Borrower | Loan Amount |
|---|---|---|---|
| Open | Blake Ronald J | $82,000 | |
| Closed | Blake Ronald J | $82,000 | |
| Previous Owner | Blake Ronald J | $70,775 |
Source: Public Records
Tax History Compared to Growth
Tax History
| Year | Tax Paid | Tax Assessment Tax Assessment Total Assessment is a certain percentage of the fair market value that is determined by local assessors to be the total taxable value of land and additions on the property. | Land | Improvement |
|---|---|---|---|---|
| 2025 | $4,458 | $248,500 | $56,600 | $191,900 |
| 2024 | $4,282 | $232,100 | $56,600 | $175,500 |
| 2023 | $4,018 | $219,300 | $56,600 | $162,700 |
| 2022 | $3,679 | $198,200 | $56,600 | $141,600 |
| 2021 | $3,280 | $170,400 | $56,600 | $113,800 |
| 2020 | $3,132 | $158,900 | $49,100 | $109,800 |
| 2019 | $2,917 | $150,200 | $45,300 | $104,900 |
| 2018 | $2,925 | $146,200 | $45,300 | $100,900 |
| 2017 | $2,835 | $144,400 | $47,200 | $97,200 |
| 2016 | $2,690 | $143,400 | $47,200 | $96,200 |
| 2015 | $2,590 | $143,400 | $47,200 | $96,200 |
Source: Public Records
Map
Nearby Homes
- 3 Tampa Ct
- 129 Newell St
- 63 Reuter Ave
- 30 Belvidere Ave
- 25 Ashley St
- 762 East St
- 72 Cleveland St
- 26 Crosier Ave
- 14 Allessio St
- 25 Putnam Ave
- 168 Elm St
- 51 Foote Ave
- 75 Livingston Ave
- 38 Northumberland Rd
- 44 Marcella Ave
- 81 Northumberland Rd
- 100 Holmes Rd
- 99 Cambridge Ave
- 40 Commonwealth Ave
- 0 Longview Terrace