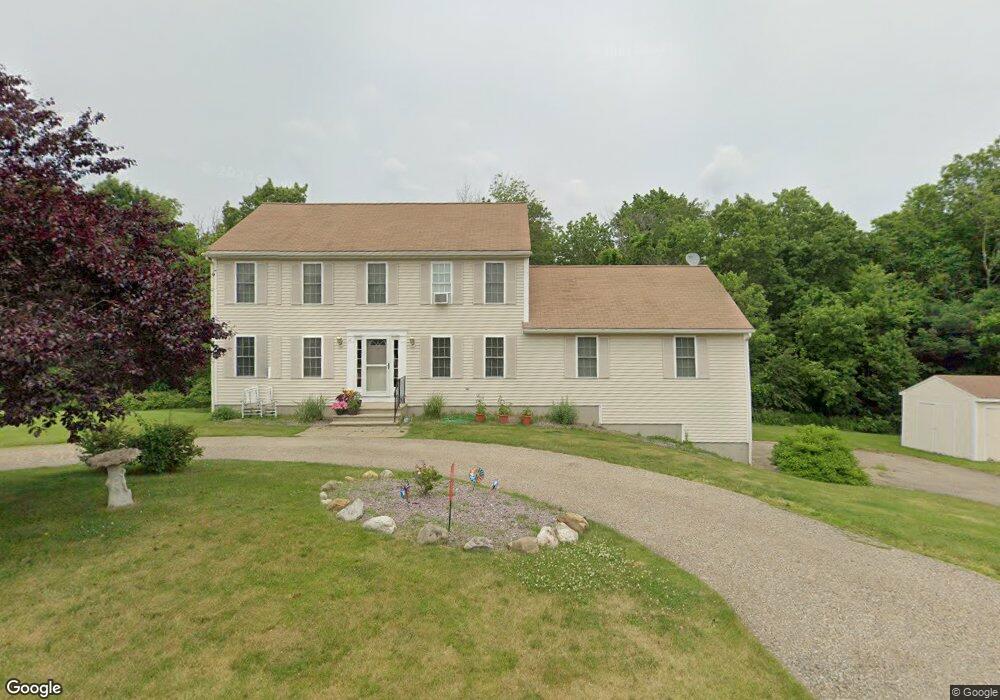
11 Hyland Ave Leicester, MA 01524
Estimated Value: $589,742 - $758,000
4
Beds
3
Baths
2,464
Sq Ft
$264/Sq Ft
Est. Value
About This Home
This home is located at 11 Hyland Ave, Leicester, MA 01524 and is currently estimated at $649,686, approximately $263 per square foot. 11 Hyland Ave is a home located in Worcester County with nearby schools including Leicester Integrated Preschool, Leicester Memorial Elementary School, and Leicester Middle School.
Ownership History
Date
Name
Owned For
Owner Type
Purchase Details
Closed on
Mar 24, 1999
Sold by
Cb Blair Dev Corp
Bought by
Lavin Joseph P and Lavin Deborah
Current Estimated Value
Purchase Details
Closed on
Dec 14, 1998
Sold by
Cb Blair Dev Corp
Bought by
Mcneil Robert D and Mcneil Evemarie B
Create a Home Valuation Report for This Property
The Home Valuation Report is an in-depth analysis detailing your home's value as well as a comparison with similar homes in the area
Home Values in the Area
Average Home Value in this Area
Purchase History
| Date | Buyer | Sale Price | Title Company |
|---|---|---|---|
| Lavin Joseph P | $216,194 | -- | |
| Mcneil Robert D | $132,500 | -- |
Source: Public Records
Mortgage History
| Date | Status | Borrower | Loan Amount |
|---|---|---|---|
| Open | Mcneil Robert D | $270,000 | |
| Closed | Mcneil Robert D | $150,000 | |
| Closed | Mcneil Robert D | $141,650 |
Source: Public Records
Tax History Compared to Growth
Tax History
| Year | Tax Paid | Tax Assessment Tax Assessment Total Assessment is a certain percentage of the fair market value that is determined by local assessors to be the total taxable value of land and additions on the property. | Land | Improvement |
|---|---|---|---|---|
| 2025 | $60 | $512,300 | $86,800 | $425,500 |
| 2024 | $5,696 | $453,900 | $74,700 | $379,200 |
| 2023 | $5,400 | $419,900 | $74,700 | $345,200 |
| 2022 | $5,193 | $371,200 | $71,000 | $300,200 |
| 2021 | $5,677 | $375,200 | $78,500 | $296,700 |
| 2020 | $5,272 | $353,600 | $74,400 | $279,200 |
| 2019 | $5,156 | $341,900 | $67,400 | $274,500 |
| 2018 | $4,933 | $306,600 | $67,400 | $239,200 |
| 2017 | $4,746 | $306,600 | $67,400 | $239,200 |
| 2016 | $4,488 | $301,200 | $71,000 | $230,200 |
| 2015 | $4,379 | $301,200 | $71,000 | $230,200 |
Source: Public Records
Map
Nearby Homes
- 27 Winslow Ave
- 0 S Main St Unit 73392435
- Lot B Paxton St
- Lot A Paxton St
- 56 Lake Sargent Dr
- 0 Hawthorne St Unit 73444632
- 1326 Main St
- 80 Rawson St
- 1472 Main St
- 500 Main St
- 19 South St
- 390 Marshall St
- 23 South St
- 135 Henshaw St
- 350 Marshall St
- 18 Brown St
- 502 Pine St
- 19 Laurelwood Ave
- 42 Upton St
- 10 Conway Dr