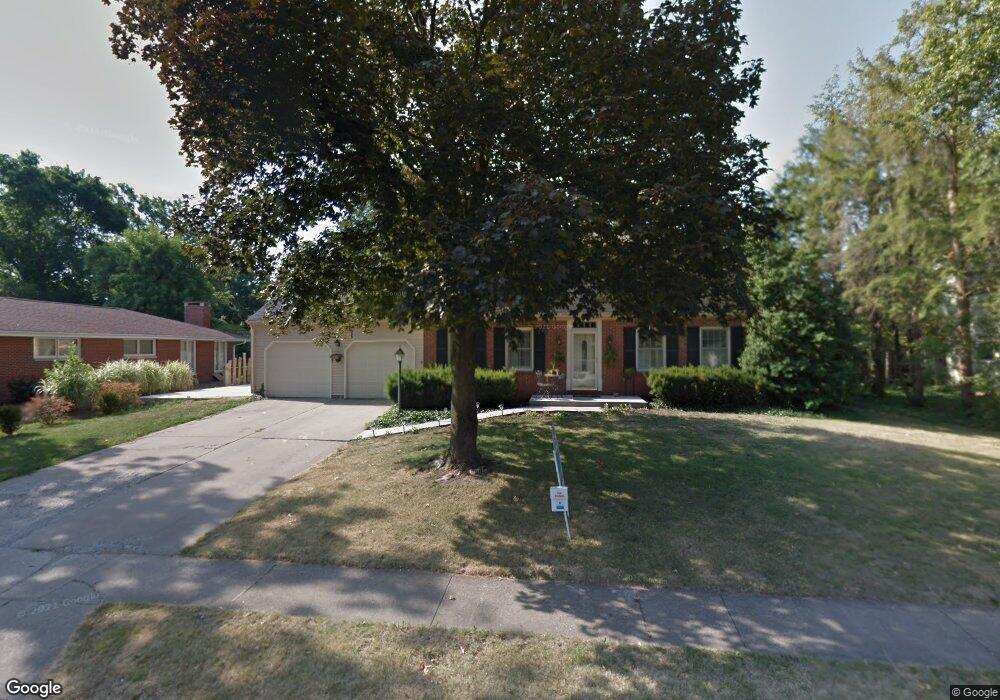
11 Ivywood Dr Jacksonville, IL 62650
Estimated Value: $236,000 - $251,000
3
Beds
3
Baths
2,300
Sq Ft
$105/Sq Ft
Est. Value
About This Home
This home is located at 11 Ivywood Dr, Jacksonville, IL 62650 and is currently estimated at $242,197, approximately $105 per square foot. 11 Ivywood Dr is a home located in Morgan County with nearby schools including Jacksonville High School, Westfair Christian Academy, and Salem Lutheran School.
Ownership History
Date
Name
Owned For
Owner Type
Purchase Details
Closed on
Apr 13, 2011
Sold by
Baker Douglas D and Baker Dana Christine
Bought by
Johnson Christopher T and Johnson Mindi L
Current Estimated Value
Purchase Details
Closed on
May 26, 2006
Sold by
Farmer James W
Bought by
Johnson Mindi Lynn
Purchase Details
Closed on
Sep 30, 2005
Sold by
Fleischer James H and Fleischer Sally Lee
Bought by
Johnson Christopher T and Farmer Mindi L
Home Financials for this Owner
Home Financials are based on the most recent Mortgage that was taken out on this home.
Original Mortgage
$164,000
Interest Rate
5.93%
Mortgage Type
New Conventional
Create a Home Valuation Report for This Property
The Home Valuation Report is an in-depth analysis detailing your home's value as well as a comparison with similar homes in the area
Home Values in the Area
Average Home Value in this Area
Purchase History
| Date | Buyer | Sale Price | Title Company |
|---|---|---|---|
| Johnson Christopher T | $34,000 | None Available | |
| Johnson Mindi Lynn | -- | None Available | |
| Johnson Christopher T | $184,000 | None Available |
Source: Public Records
Mortgage History
| Date | Status | Borrower | Loan Amount |
|---|---|---|---|
| Previous Owner | Johnson Christopher T | $164,000 |
Source: Public Records
Tax History Compared to Growth
Tax History
| Year | Tax Paid | Tax Assessment Tax Assessment Total Assessment is a certain percentage of the fair market value that is determined by local assessors to be the total taxable value of land and additions on the property. | Land | Improvement |
|---|---|---|---|---|
| 2024 | $6,147 | $76,750 | $8,500 | $68,250 |
| 2023 | $6,044 | $70,110 | $8,500 | $61,610 |
| 2022 | $5,263 | $61,240 | $8,500 | $52,740 |
| 2021 | $4,991 | $59,510 | $8,500 | $51,010 |
| 2020 | $4,994 | $58,340 | $8,500 | $49,840 |
| 2019 | $4,958 | $58,340 | $8,500 | $49,840 |
| 2018 | $4,993 | $60,800 | $10,760 | $50,040 |
| 2017 | $4,884 | $60,800 | $10,760 | $50,040 |
| 2016 | $4,674 | $57,910 | $10,250 | $47,660 |
| 2015 | $4,561 | $55,690 | $9,860 | $45,830 |
| 2014 | $4,561 | $55,140 | $9,760 | $45,380 |
| 2013 | $4,247 | $55,140 | $9,760 | $45,380 |
Source: Public Records
Map
Nearby Homes
- 3 Ivywood Dr
- 207 Mound Place
- 1856 Plum St
- 17 Merrygrove Dr
- 1815 Mound Rd
- 8 Westfair Dr
- 1835 Mound Rd
- 1924 Cedar St
- 2 Valleyview Rd
- 1903 Mound Rd
- 414 S Westgate Ave
- 33 Windrush Dr
- 12 Newland Ln
- 13 Morningside Dr
- 307 Westwinds Dr
- 510 S Westgate Ave
- 400 Massey Ln
- 121 City Place
- 1503 Mound Ave
- 1325 W College Ave