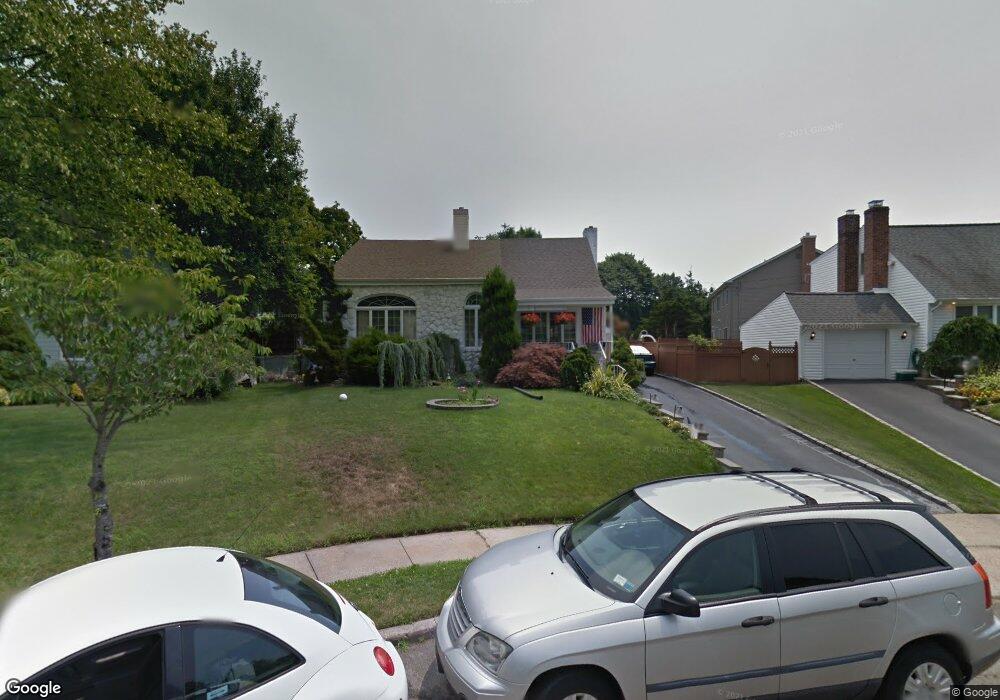
11 Jackson Ct Syosset, NY 11791
Estimated Value: $1,126,000 - $1,198,871
4
Beds
4
Baths
1,968
Sq Ft
$591/Sq Ft
Est. Value
About This Home
This home is located at 11 Jackson Ct, Syosset, NY 11791 and is currently estimated at $1,162,436, approximately $590 per square foot. 11 Jackson Ct is a home located in Nassau County with nearby schools including Syosset Senior High School and St Edward Confessor School.
Ownership History
Date
Name
Owned For
Owner Type
Purchase Details
Closed on
Sep 15, 2017
Sold by
Boscia Philip and Boscia Marci
Bought by
Pradham Manish Lal
Current Estimated Value
Home Financials for this Owner
Home Financials are based on the most recent Mortgage that was taken out on this home.
Original Mortgage
$67,500
Outstanding Balance
$56,217
Interest Rate
3.89%
Mortgage Type
Credit Line Revolving
Estimated Equity
$1,106,219
Create a Home Valuation Report for This Property
The Home Valuation Report is an in-depth analysis detailing your home's value as well as a comparison with similar homes in the area
Home Values in the Area
Average Home Value in this Area
Purchase History
| Date | Buyer | Sale Price | Title Company |
|---|---|---|---|
| Pradham Manish Lal | $675,000 | Encore Title Agency Inc |
Source: Public Records
Mortgage History
| Date | Status | Borrower | Loan Amount |
|---|---|---|---|
| Open | Pradham Manish Lal | $67,500 |
Source: Public Records
Tax History
| Year | Tax Paid | Tax Assessment Tax Assessment Total Assessment is a certain percentage of the fair market value that is determined by local assessors to be the total taxable value of land and additions on the property. | Land | Improvement |
|---|---|---|---|---|
| 2025 | $24,366 | $776 | $358 | $418 |
| 2024 | $6,554 | $776 | $358 | $418 |
| 2023 | $21,802 | $776 | $358 | $418 |
| 2022 | $21,802 | $776 | $358 | $418 |
| 2021 | $20,867 | $755 | $348 | $407 |
| 2020 | $19,367 | $940 | $706 | $234 |
| 2019 | $4,883 | $940 | $706 | $234 |
| 2018 | $10,275 | $940 | $0 | $0 |
| 2017 | $12,207 | $1,223 | $706 | $517 |
| 2016 | $18,076 | $1,223 | $706 | $517 |
| 2015 | $5,357 | $1,223 | $706 | $517 |
| 2014 | $5,357 | $1,223 | $706 | $517 |
| 2013 | $4,939 | $1,223 | $706 | $517 |
Source: Public Records
Map
Nearby Homes
Your Personal Tour Guide
Ask me questions while you tour the home.