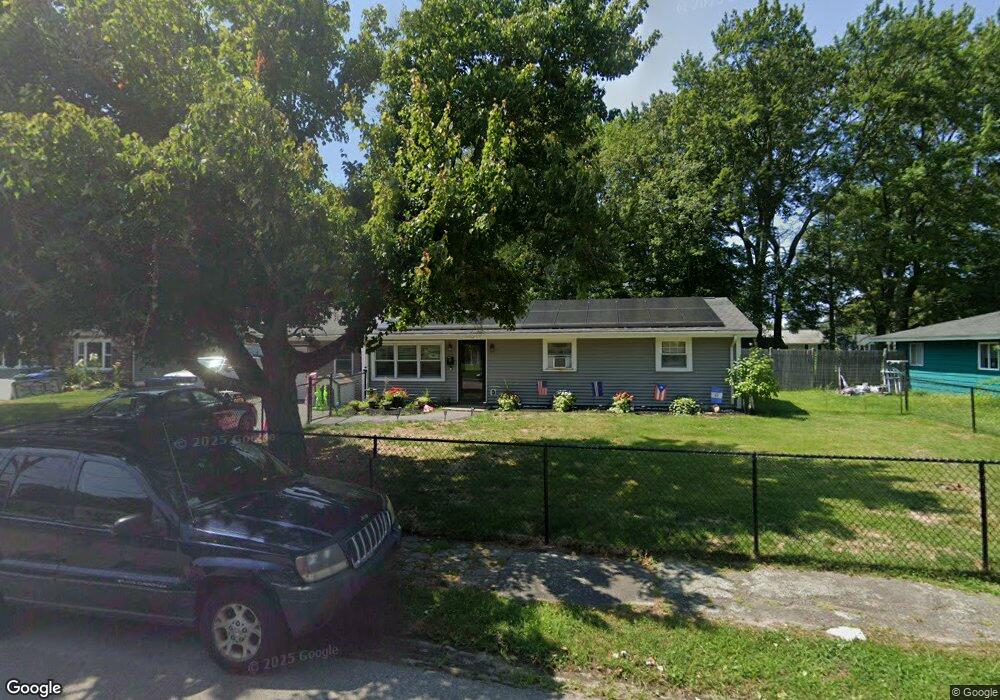
11 James St Holbrook, MA 02343
Estimated Value: $484,110 - $513,000
3
Beds
1
Bath
1,188
Sq Ft
$420/Sq Ft
Est. Value
About This Home
This home is located at 11 James St, Holbrook, MA 02343 and is currently estimated at $498,528, approximately $419 per square foot. 11 James St is a home located in Norfolk County with nearby schools including John F. Kennedy Elementary School, Holbrook Middle High School, and Boston Higashi School.
Ownership History
Date
Name
Owned For
Owner Type
Purchase Details
Closed on
Dec 20, 2019
Sold by
Cadegan Virginia F Est and Cadegan
Bought by
Santiago Samuel
Current Estimated Value
Home Financials for this Owner
Home Financials are based on the most recent Mortgage that was taken out on this home.
Original Mortgage
$294,566
Outstanding Balance
$259,702
Interest Rate
3.6%
Mortgage Type
FHA
Estimated Equity
$238,826
Create a Home Valuation Report for This Property
The Home Valuation Report is an in-depth analysis detailing your home's value as well as a comparison with similar homes in the area
Home Values in the Area
Average Home Value in this Area
Purchase History
| Date | Buyer | Sale Price | Title Company |
|---|---|---|---|
| Santiago Samuel | $300,000 | None Available | |
| Santiago Samuel | $300,000 | None Available | |
| Santiago Samuel | $300,000 | None Available |
Source: Public Records
Mortgage History
| Date | Status | Borrower | Loan Amount |
|---|---|---|---|
| Open | Santiago Samuel | $294,566 | |
| Closed | Santiago Samuel | $294,566 |
Source: Public Records
Tax History
| Year | Tax Paid | Tax Assessment Tax Assessment Total Assessment is a certain percentage of the fair market value that is determined by local assessors to be the total taxable value of land and additions on the property. | Land | Improvement |
|---|---|---|---|---|
| 2025 | $53 | $400,300 | $228,200 | $172,100 |
| 2024 | $5,204 | $387,200 | $223,200 | $164,000 |
| 2023 | $5,394 | $350,700 | $195,800 | $154,900 |
| 2022 | $4,927 | $298,800 | $186,500 | $112,300 |
| 2021 | $4,730 | $274,700 | $168,000 | $106,700 |
| 2020 | $4,925 | $268,100 | $166,200 | $101,900 |
| 2019 | $4,713 | $242,200 | $145,700 | $96,500 |
| 2018 | $4,717 | $228,200 | $134,900 | $93,300 |
| 2017 | $4,454 | $213,100 | $123,000 | $90,100 |
| 2016 | $3,954 | $201,300 | $116,100 | $85,200 |
| 2015 | $3,635 | $190,500 | $109,100 | $81,400 |
| 2014 | $3,504 | $186,700 | $109,100 | $77,600 |
Source: Public Records
Map
Nearby Homes
- 35 Marion St
- 88 Roseen Rd
- 375 S Franklin St Unit 1
- 95 Rindone St
- 181 S Franklin St Unit 102
- 181 S Franklin St Unit 206
- 24 Reeds Ln
- 152 S Franklin St
- 360 Plymouth St
- 58 Chandler St
- 52 Quincy St
- 45-R Ernest St
- 719 S Franklin St Unit C Block 1
- 123-125 N Franklin St
- 27 Winter St
- 36 Summer St
- 63 Sycamore St
- 184 Belcher St
- 5 Clarendon Cir Unit Lot 4
- 14 Leonard Ln
Your Personal Tour Guide
Ask me questions while you tour the home.