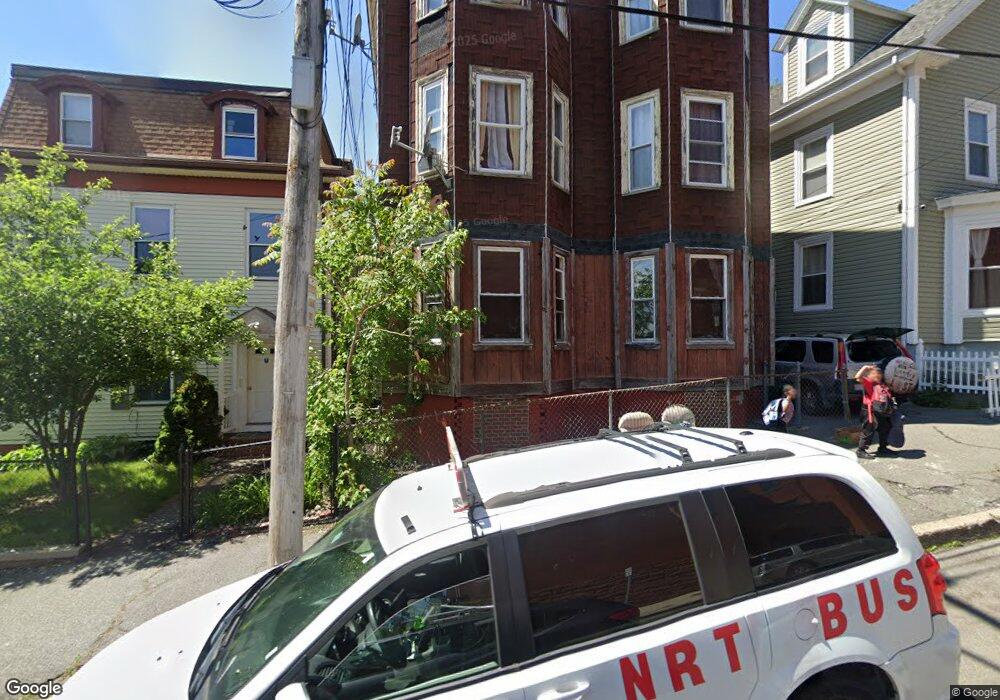
11 James St Lynn, MA 01902
Downtown Lynn NeighborhoodEstimated Value: $796,912 - $936,000
9
Beds
3
Baths
3,537
Sq Ft
$250/Sq Ft
Est. Value
About This Home
This home is located at 11 James St, Lynn, MA 01902 and is currently estimated at $882,728, approximately $249 per square foot. 11 James St is a home located in Essex County with nearby schools including Washington Elementary School, William R. Fallon School, and Heidelberg Junior High School.
Ownership History
Date
Name
Owned For
Owner Type
Purchase Details
Closed on
Oct 1, 1993
Sold by
Fdic
Bought by
11 James Street Rt
Current Estimated Value
Purchase Details
Closed on
Aug 28, 1987
Sold by
Bencosme Jose
Bought by
Bencosme Jose
Home Financials for this Owner
Home Financials are based on the most recent Mortgage that was taken out on this home.
Original Mortgage
$30,000
Interest Rate
10.24%
Mortgage Type
Purchase Money Mortgage
Create a Home Valuation Report for This Property
The Home Valuation Report is an in-depth analysis detailing your home's value as well as a comparison with similar homes in the area
Home Values in the Area
Average Home Value in this Area
Purchase History
| Date | Buyer | Sale Price | Title Company |
|---|---|---|---|
| 11 James Street Rt | $12,500 | -- | |
| 11 James Street Rt | $12,500 | -- | |
| Bencosme Jose | $93,000 | -- |
Source: Public Records
Mortgage History
| Date | Status | Borrower | Loan Amount |
|---|---|---|---|
| Open | Bencosme Jose | $300,000 | |
| Previous Owner | Bencosme Jose | $62,000 | |
| Previous Owner | Bencosme Jose | $30,000 |
Source: Public Records
Tax History Compared to Growth
Tax History
| Year | Tax Paid | Tax Assessment Tax Assessment Total Assessment is a certain percentage of the fair market value that is determined by local assessors to be the total taxable value of land and additions on the property. | Land | Improvement |
|---|---|---|---|---|
| 2025 | $7,826 | $755,400 | $180,500 | $574,900 |
| 2024 | $7,822 | $742,800 | $174,100 | $568,700 |
| 2023 | $7,184 | $644,300 | $137,200 | $507,100 |
| 2022 | $7,170 | $576,800 | $123,900 | $452,900 |
| 2021 | $6,798 | $521,700 | $109,900 | $411,800 |
| 2020 | $6,453 | $481,600 | $103,500 | $378,100 |
| 2019 | $6,138 | $429,200 | $87,400 | $341,800 |
| 2018 | $5,692 | $375,700 | $86,600 | $289,100 |
| 2017 | $5,365 | $343,900 | $76,200 | $267,700 |
| 2016 | $4,793 | $296,200 | $57,400 | $238,800 |
| 2015 | $4,325 | $258,200 | $54,500 | $203,700 |
Source: Public Records
Map
Nearby Homes
- 374-378 Washington St
- 589 Essex St Unit 303
- 589 Essex St Unit 102
- 0 High St
- 13 Willow St Unit 206
- 5 Whittier St
- 191-193 Washington St
- 440 Essex St
- 170 Oxford St Unit 503
- 170 Oxford St Unit 402
- 57 Johnson St
- 49 Munroe St Unit 306
- 49 Munroe St Unit 201
- 10 Pleasant St Unit 202
- 380 Essex St
- 42 Joyce St Unit H
- 105 Lawton Ave
- 2 Mount Vernon St
- 121 Johnson St Unit 3L
- 81A Franklin St
- 9 James St
- 9 James St Unit A
- 15 James St
- 9A James St
- 7 James St
- 524 Essex St
- 22 James St Unit 24
- 22-24 James St
- 26 James St
- 525 Essex St
- 535 Essex St
- 531 Essex St
- 529 Essex St
- 531 Essex St Unit 2
- 537 Essex St
- 521 Essex St
- 592 Essex St Unit 1
- 592 Essex St Unit 2
- 592 Essex St Unit 3
- 592 Essex St Unit 616