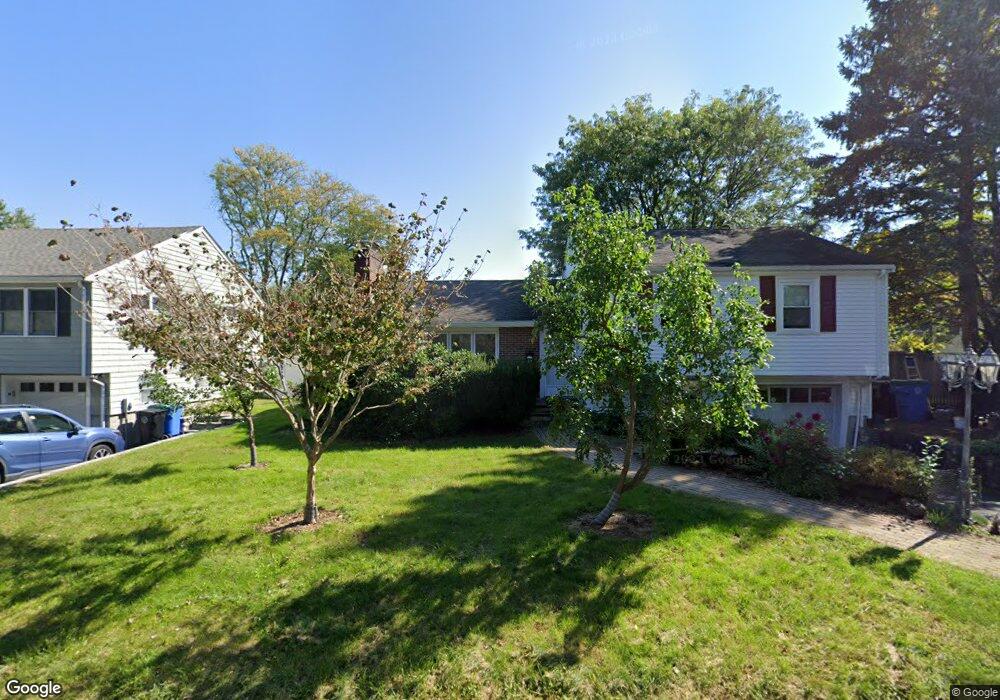
11 Jason Rd Belmont, MA 02478
Belmont Center NeighborhoodEstimated Value: $1,429,000 - $1,576,000
4
Beds
2
Baths
1,822
Sq Ft
$822/Sq Ft
Est. Value
About This Home
This home is located at 11 Jason Rd, Belmont, MA 02478 and is currently estimated at $1,497,990, approximately $822 per square foot. 11 Jason Rd is a home located in Middlesex County with nearby schools including Winn Brook Elementary School, Winthrop L Chenery Middle School, and Belmont High School.
Ownership History
Date
Name
Owned For
Owner Type
Purchase Details
Closed on
Sep 1, 2010
Sold by
Maletta-Robak Rita L
Bought by
Shu Bo and Guo Xiaoyan
Current Estimated Value
Home Financials for this Owner
Home Financials are based on the most recent Mortgage that was taken out on this home.
Original Mortgage
$372,000
Outstanding Balance
$247,011
Interest Rate
4.55%
Mortgage Type
Purchase Money Mortgage
Estimated Equity
$1,250,979
Create a Home Valuation Report for This Property
The Home Valuation Report is an in-depth analysis detailing your home's value as well as a comparison with similar homes in the area
Home Values in the Area
Average Home Value in this Area
Purchase History
| Date | Buyer | Sale Price | Title Company |
|---|---|---|---|
| Shu Bo | $620,000 | -- |
Source: Public Records
Mortgage History
| Date | Status | Borrower | Loan Amount |
|---|---|---|---|
| Open | Shu Bo | $372,000 |
Source: Public Records
Tax History Compared to Growth
Tax History
| Year | Tax Paid | Tax Assessment Tax Assessment Total Assessment is a certain percentage of the fair market value that is determined by local assessors to be the total taxable value of land and additions on the property. | Land | Improvement |
|---|---|---|---|---|
| 2025 | $14,613 | $1,283,000 | $747,000 | $536,000 |
| 2024 | $13,644 | $1,292,000 | $880,000 | $412,000 |
| 2023 | $14,219 | $1,265,000 | $879,000 | $386,000 |
| 2022 | $12,486 | $1,148,000 | $804,000 | $344,000 |
| 2021 | $38 | $1,082,000 | $796,000 | $286,000 |
| 2020 | $20 | $1,070,000 | $784,000 | $286,000 |
| 2019 | $10,130 | $868,000 | $607,000 | $261,000 |
| 2018 | $9,817 | $808,000 | $547,000 | $261,000 |
| 2017 | $28 | $762,000 | $501,000 | $261,000 |
| 2016 | $10,500 | $836,000 | $501,000 | $335,000 |
| 2015 | $8,837 | $685,000 | $426,000 | $259,000 |
Source: Public Records
Map
Nearby Homes
- 176 Channing Rd
- 7 Broad St
- 125 Channing Rd
- 129 Alexander Ave
- 125 Claflin St
- 1 Spinney Terrace
- 38 Myrtle St
- 314 Channing Rd
- 242 Claflin St
- 73 Trowbridge St Unit 73B
- 73 Trowbridge St Unit 73A
- 51 Stella Rd
- 33 Wellington Ln
- 16 Fairmont St
- 48 Hamilton Rd
- 315 Waverley St
- 326 Lake St
- 335 Lake St
- 41 Concord Ave
- 560 Concord Ave