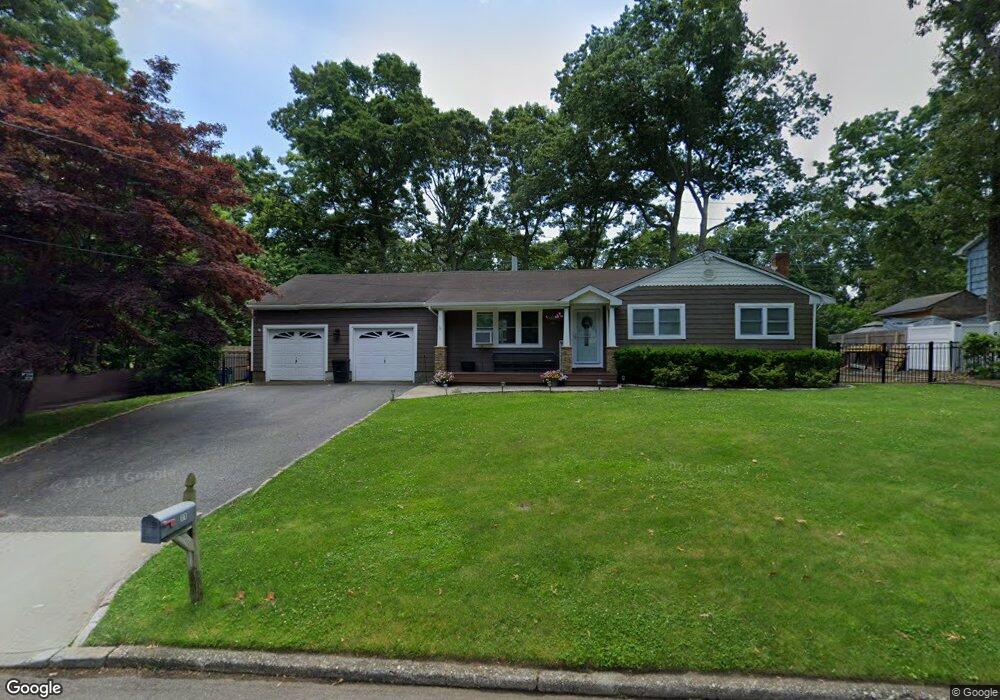
11 John St Shoreham, NY 11786
Estimated Value: $595,803 - $672,000
3
Beds
2
Baths
1,120
Sq Ft
$567/Sq Ft
Est. Value
About This Home
This home is located at 11 John St, Shoreham, NY 11786 and is currently estimated at $635,201, approximately $567 per square foot. 11 John St is a home located in Suffolk County with nearby schools including Miller Avenue School, Wading River School, and Albert G Prodell Middle School.
Ownership History
Date
Name
Owned For
Owner Type
Purchase Details
Closed on
Jul 19, 2016
Sold by
B & B J & J K & K Properties Of Smithtown Inc
Bought by
Connolly Jason and Zahn Jennifer Ann
Current Estimated Value
Home Financials for this Owner
Home Financials are based on the most recent Mortgage that was taken out on this home.
Original Mortgage
$289,377
Outstanding Balance
$232,268
Interest Rate
3.75%
Mortgage Type
FHA
Estimated Equity
$402,933
Purchase Details
Closed on
Dec 14, 2015
Sold by
Bartlett Gerard and Estate Of Wheeler Eileen
Bought by
B & B J & J K & K Properties Of Smithtown Inc
Purchase Details
Closed on
Nov 10, 2014
Sold by
Carpenter Angie M and County Treasurer Of The County Of Suffol
Bought by
County Of Suffolk
Create a Home Valuation Report for This Property
The Home Valuation Report is an in-depth analysis detailing your home's value as well as a comparison with similar homes in the area
Home Values in the Area
Average Home Value in this Area
Purchase History
| Date | Buyer | Sale Price | Title Company |
|---|---|---|---|
| Connolly Jason | $316,000 | Advantage Title Agency | |
| B & B J & J K & K Properties Of Smithtown Inc | $117,500 | None Available | |
| County Of Suffolk | -- | None Available |
Source: Public Records
Mortgage History
| Date | Status | Borrower | Loan Amount |
|---|---|---|---|
| Open | Connolly Jason | $289,377 |
Source: Public Records
Tax History
| Year | Tax Paid | Tax Assessment Tax Assessment Total Assessment is a certain percentage of the fair market value that is determined by local assessors to be the total taxable value of land and additions on the property. | Land | Improvement |
|---|---|---|---|---|
| 2024 | $11,945 | $2,950 | $300 | $2,650 |
| 2023 | $11,945 | $2,950 | $300 | $2,650 |
| 2022 | $10,559 | $2,950 | $300 | $2,650 |
| 2021 | $10,559 | $2,950 | $300 | $2,650 |
| 2020 | $10,647 | $2,950 | $300 | $2,650 |
| 2019 | $10,647 | $0 | $0 | $0 |
| 2018 | $10,375 | $2,950 | $300 | $2,650 |
| 2017 | $10,375 | $2,950 | $300 | $2,650 |
| 2016 | $10,298 | $2,950 | $300 | $2,650 |
| 2015 | -- | $2,950 | $300 | $2,650 |
| 2014 | -- | $2,950 | $300 | $2,650 |
Source: Public Records
Map
Nearby Homes
Your Personal Tour Guide
Ask me questions while you tour the home.