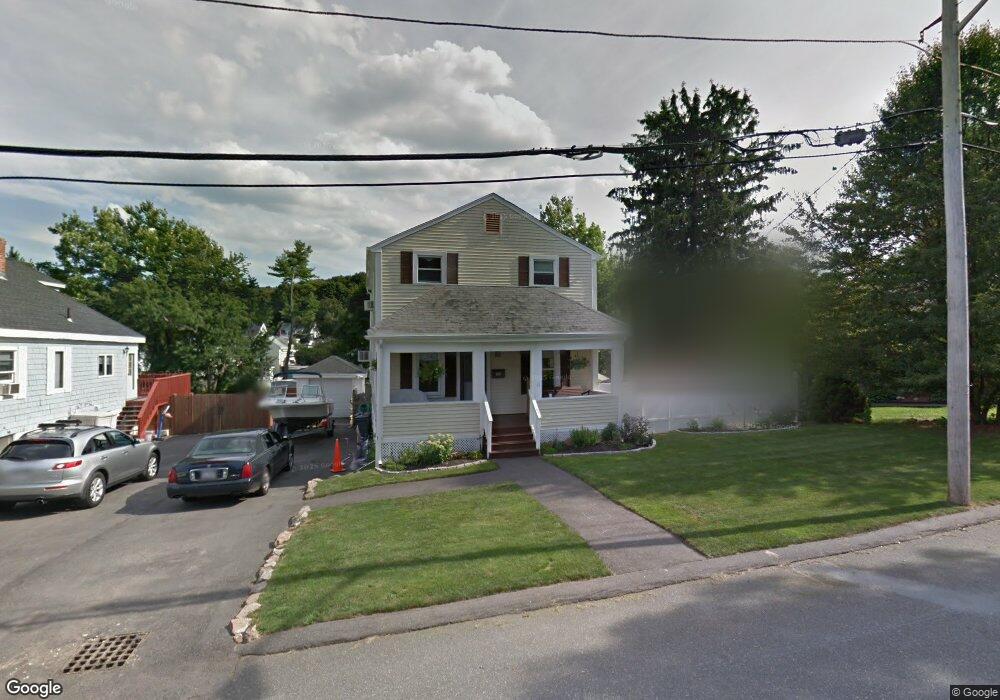
11 Johnson Rd Saugus, MA 01906
Cliftondale NeighborhoodEstimated Value: $637,000 - $703,000
4
Beds
2
Baths
1,632
Sq Ft
$413/Sq Ft
Est. Value
About This Home
This home is located at 11 Johnson Rd, Saugus, MA 01906 and is currently estimated at $674,060, approximately $413 per square foot. 11 Johnson Rd is a home located in Essex County with nearby schools including Saugus High School, Pioneer Charter School Of Science II, and Sacred Heart School.
Ownership History
Date
Name
Owned For
Owner Type
Purchase Details
Closed on
Mar 15, 2007
Sold by
Lanteigne Gale
Bought by
Valley Derek M and Valley Susan L
Current Estimated Value
Home Financials for this Owner
Home Financials are based on the most recent Mortgage that was taken out on this home.
Original Mortgage
$280,000
Outstanding Balance
$169,089
Interest Rate
6.4%
Mortgage Type
Purchase Money Mortgage
Estimated Equity
$504,971
Purchase Details
Closed on
Aug 20, 2004
Sold by
Mcdonough Dianne J and Mcdonough John S
Bought by
Lanteigne Gale
Purchase Details
Closed on
Dec 2, 1991
Sold by
Baldwin Theresa B
Bought by
Mcdonough John S and Dianne Mcdonough
Create a Home Valuation Report for This Property
The Home Valuation Report is an in-depth analysis detailing your home's value as well as a comparison with similar homes in the area
Home Values in the Area
Average Home Value in this Area
Purchase History
| Date | Buyer | Sale Price | Title Company |
|---|---|---|---|
| Valley Derek M | $350,000 | -- | |
| Lanteigne Gale | $390,000 | -- | |
| Mcdonough John S | $118,000 | -- |
Source: Public Records
Mortgage History
| Date | Status | Borrower | Loan Amount |
|---|---|---|---|
| Open | Mcdonough John S | $280,000 | |
| Closed | Mcdonough John S | $35,000 |
Source: Public Records
Tax History Compared to Growth
Tax History
| Year | Tax Paid | Tax Assessment Tax Assessment Total Assessment is a certain percentage of the fair market value that is determined by local assessors to be the total taxable value of land and additions on the property. | Land | Improvement |
|---|---|---|---|---|
| 2025 | $6,408 | $600,000 | $317,200 | $282,800 |
| 2024 | $6,142 | $576,700 | $299,100 | $277,600 |
| 2023 | $5,917 | $525,500 | $262,800 | $262,700 |
| 2022 | $5,594 | $465,800 | $241,100 | $224,700 |
| 2021 | $5,356 | $434,000 | $209,300 | $224,700 |
| 2020 | $4,958 | $415,900 | $199,400 | $216,500 |
| 2019 | $4,747 | $389,700 | $181,300 | $208,400 |
| 2018 | $4,414 | $381,200 | $175,800 | $205,400 |
| 2017 | $4,186 | $347,400 | $164,000 | $183,400 |
| 2016 | $3,418 | $280,200 | $163,800 | $116,400 |
| 2015 | $3,208 | $266,900 | $156,000 | $110,900 |
| 2014 | $3,317 | $285,700 | $156,000 | $129,700 |
Source: Public Records
Map
Nearby Homes
- 5 Springdale Ave
- 33 Springdale Ave
- 5 Stanley Terrace
- 17 Elaine Ave
- 62 Chestnut St Unit 4
- 62 Chestnut St Unit 2
- 22 Laconia Ave
- 9 Oakwood Ave
- 24 Ballard St
- 9 Douglas Rd
- 0 Hampton St
- 12 Seagirt Ave
- 9 Spencer Ave
- 44 Ballard St
- 18 Nason Rd
- 25 Auburn St
- 4 Oneil Way
- 771 Boston St
- 431 Central St
- 483 Central St Unit A