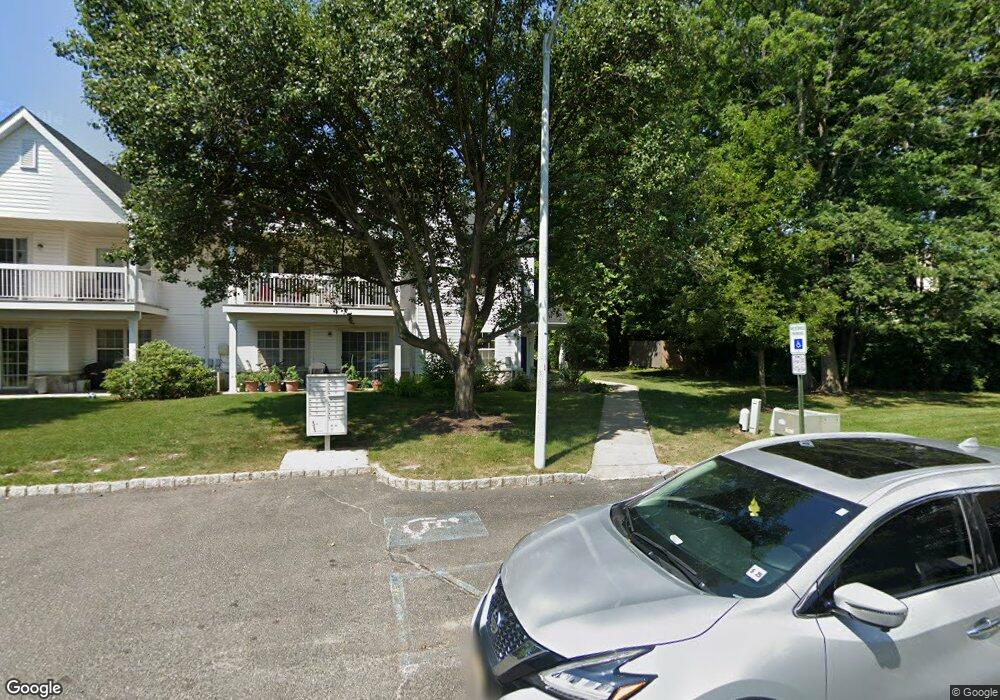
11 Juneau Ct Unit 311 Tinton Falls, NJ 07712
Estimated Value: $419,898 - $478,000
2
Beds
2
Baths
1,156
Sq Ft
$383/Sq Ft
Est. Value
About This Home
This home is located at 11 Juneau Ct Unit 311, Tinton Falls, NJ 07712 and is currently estimated at $442,975, approximately $383 per square foot. 11 Juneau Ct Unit 311 is a home located in Monmouth County with nearby schools including Mahala F. Atchinson Elementary School, Swimming River Elementary School, and Tinton Falls Middle School.
Ownership History
Date
Name
Owned For
Owner Type
Purchase Details
Closed on
Jun 30, 2009
Sold by
Raso Noreen
Bought by
Gomes Tracey
Current Estimated Value
Home Financials for this Owner
Home Financials are based on the most recent Mortgage that was taken out on this home.
Original Mortgage
$211,640
Outstanding Balance
$135,438
Interest Rate
4.93%
Mortgage Type
FHA
Estimated Equity
$307,537
Purchase Details
Closed on
Mar 10, 1998
Sold by
O'Leary Gary
Bought by
Nolan Edward
Home Financials for this Owner
Home Financials are based on the most recent Mortgage that was taken out on this home.
Original Mortgage
$45,000
Interest Rate
6.96%
Create a Home Valuation Report for This Property
The Home Valuation Report is an in-depth analysis detailing your home's value as well as a comparison with similar homes in the area
Home Values in the Area
Average Home Value in this Area
Purchase History
| Date | Buyer | Sale Price | Title Company |
|---|---|---|---|
| Gomes Tracey | $220,000 | Fidelity Natl Title Ins Co | |
| Nolan Edward | $95,000 | -- |
Source: Public Records
Mortgage History
| Date | Status | Borrower | Loan Amount |
|---|---|---|---|
| Open | Gomes Tracey | $211,640 | |
| Previous Owner | Nolan Edward | $45,000 |
Source: Public Records
Tax History Compared to Growth
Tax History
| Year | Tax Paid | Tax Assessment Tax Assessment Total Assessment is a certain percentage of the fair market value that is determined by local assessors to be the total taxable value of land and additions on the property. | Land | Improvement |
|---|---|---|---|---|
| 2025 | $5,262 | $395,000 | $206,700 | $188,300 |
| 2024 | $5,495 | $365,700 | $181,700 | $184,000 |
| 2023 | $5,495 | $360,100 | $175,000 | $185,100 |
| 2022 | $4,744 | $291,200 | $115,000 | $176,200 |
| 2021 | $4,727 | $246,300 | $105,000 | $141,300 |
| 2020 | $4,850 | $243,100 | $105,000 | $138,100 |
| 2019 | $4,727 | $237,300 | $100,000 | $137,300 |
| 2018 | $4,613 | $230,900 | $100,000 | $130,900 |
| 2017 | $4,547 | $221,900 | $95,000 | $126,900 |
| 2016 | $4,693 | $223,900 | $90,000 | $133,900 |
| 2015 | $4,562 | $220,400 | $90,000 | $130,400 |
| 2014 | $4,425 | $204,500 | $70,000 | $134,500 |
Source: Public Records
Map
Nearby Homes