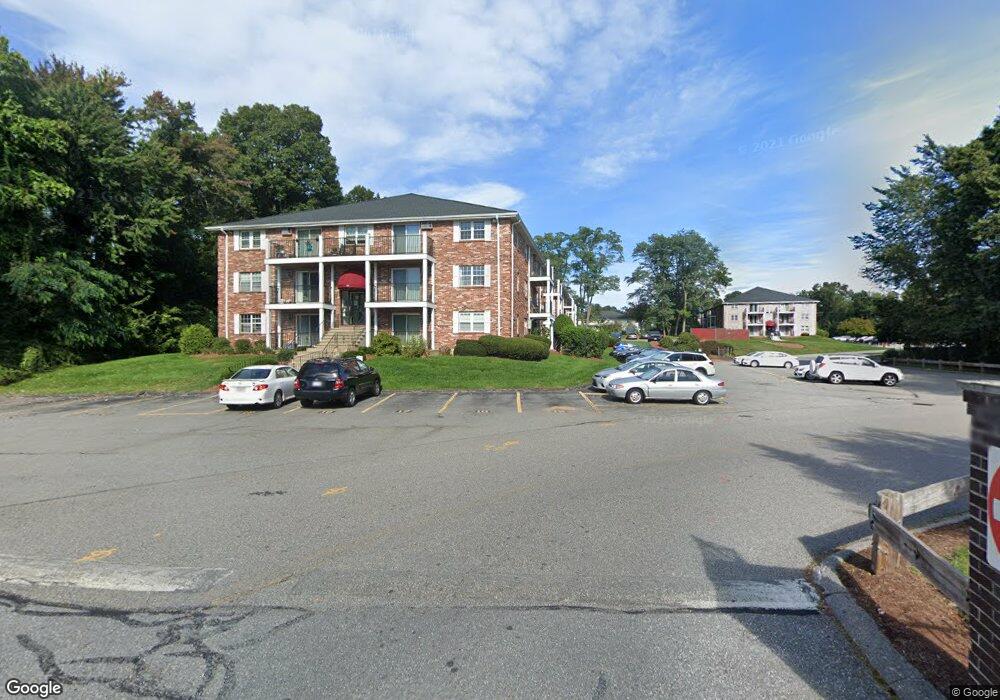
11 Kenmar Dr Unit 3 Billerica, MA 01821
Estimated Value: $255,000 - $332,000
1
Bed
1
Bath
610
Sq Ft
$459/Sq Ft
Est. Value
About This Home
This home is located at 11 Kenmar Dr Unit 3, Billerica, MA 01821 and is currently estimated at $280,184, approximately $459 per square foot. 11 Kenmar Dr Unit 3 is a home located in Middlesex County with nearby schools including Billerica Memorial High School.
Ownership History
Date
Name
Owned For
Owner Type
Purchase Details
Closed on
Sep 30, 2010
Sold by
Kelly Michael C
Bought by
Bumann Brenda A and Hartwell Christine M
Current Estimated Value
Purchase Details
Closed on
Nov 30, 2000
Sold by
Belmonte Maria C
Bought by
Kelly Michael C
Home Financials for this Owner
Home Financials are based on the most recent Mortgage that was taken out on this home.
Original Mortgage
$83,100
Interest Rate
7.76%
Mortgage Type
Purchase Money Mortgage
Purchase Details
Closed on
Dec 1, 1998
Sold by
Mandel Bruce I
Bought by
Belmonte Maria C
Home Financials for this Owner
Home Financials are based on the most recent Mortgage that was taken out on this home.
Original Mortgage
$42,700
Interest Rate
6.83%
Mortgage Type
Purchase Money Mortgage
Purchase Details
Closed on
Jun 28, 1991
Sold by
Bemis Janice L
Bought by
Mandel Bruce I
Home Financials for this Owner
Home Financials are based on the most recent Mortgage that was taken out on this home.
Original Mortgage
$52,600
Interest Rate
9.44%
Mortgage Type
Purchase Money Mortgage
Create a Home Valuation Report for This Property
The Home Valuation Report is an in-depth analysis detailing your home's value as well as a comparison with similar homes in the area
Home Values in the Area
Average Home Value in this Area
Purchase History
| Date | Buyer | Sale Price | Title Company |
|---|---|---|---|
| Bumann Brenda A | $125,000 | -- | |
| Kelly Michael C | $103,900 | -- | |
| Belmonte Maria C | $61,000 | -- | |
| Mandel Bruce I | $58,500 | -- |
Source: Public Records
Mortgage History
| Date | Status | Borrower | Loan Amount |
|---|---|---|---|
| Previous Owner | Mandel Bruce I | $83,100 | |
| Previous Owner | Mandel Bruce I | $42,700 | |
| Previous Owner | Mandel Bruce I | $52,600 |
Source: Public Records
Tax History Compared to Growth
Tax History
| Year | Tax Paid | Tax Assessment Tax Assessment Total Assessment is a certain percentage of the fair market value that is determined by local assessors to be the total taxable value of land and additions on the property. | Land | Improvement |
|---|---|---|---|---|
| 2025 | $2,861 | $251,600 | $0 | $251,600 |
| 2024 | $2,666 | $236,100 | $0 | $236,100 |
| 2023 | $2,386 | $201,000 | $0 | $201,000 |
| 2022 | $2,255 | $178,400 | $0 | $178,400 |
| 2021 | $2,139 | $164,500 | $0 | $164,500 |
| 2020 | $2,039 | $157,000 | $0 | $157,000 |
| 2019 | $1,870 | $138,700 | $0 | $138,700 |
| 2018 | $1,806 | $127,300 | $0 | $127,300 |
| 2017 | $1,455 | $103,300 | $0 | $103,300 |
| 2016 | $1,447 | $102,300 | $0 | $102,300 |
| 2015 | $1,300 | $92,600 | $0 | $92,600 |
| 2014 | $1,312 | $91,800 | $0 | $91,800 |
Source: Public Records
Map
Nearby Homes
- 5 Karen Cir Unit 16
- 14 Kenmar Dr Unit 111
- 22 Kenmar Dr Unit 194Y
- 10 Charnstaff Ln Unit 204
- 1 Purcell Dr
- 405 Boston Rd Unit 2
- 19 Parker St
- 454 Middlesex Turnpike
- 463 Middlesex Turnpike
- 8 Swan Ln
- 14 Elsie Ave
- 396 Boston Rd Unit 103
- 481 Middlesex Turnpike
- 483 Middlesex Turnpike
- 10 Avondale Ave
- 37 Porter St
- 86 Lexington Rd
- 88 Lexington Rd
- 32 Marshall St
- 79 Bridle Rd
- 11 Kenmar Dr Unit 9
- 11 Kenmar Dr Unit 8
- 11 Kenmar Dr Unit 7
- 11 Kenmar Dr Unit 6
- 11 Kenmar Dr Unit 5
- 11 Kenmar Dr Unit 4
- 11 Kenmar Dr Unit 24
- 11 Kenmar Dr Unit 23
- 11 Kenmar Dr Unit 22
- 11 Kenmar Dr Unit 21
- 11 Kenmar Dr Unit 20
- 11 Kenmar Dr Unit 2
- 11 Kenmar Dr Unit 19
- 11 Kenmar Dr Unit 18
- 11 Kenmar Dr Unit 17
- 11 Kenmar Dr Unit 16
- 11 Kenmar Dr Unit 15
- 11 Kenmar Dr Unit 14
- 11 Kenmar Dr Unit 12
- 11 Kenmar Dr