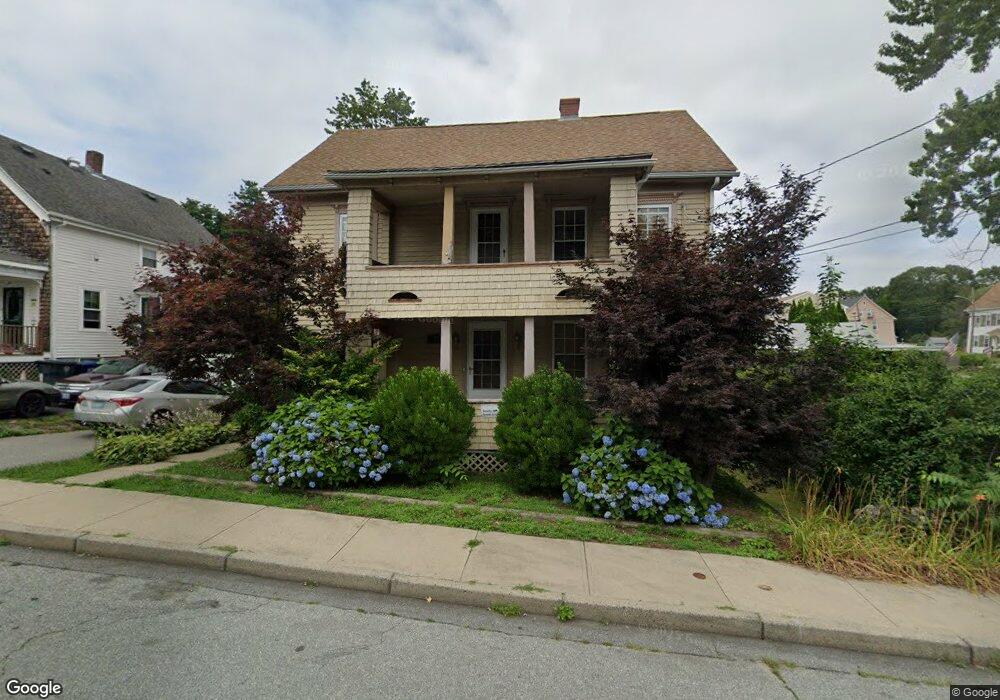
11 King St Warwick, RI 02886
Natick NeighborhoodEstimated Value: $502,000 - $592,884
5
Beds
2
Baths
1,997
Sq Ft
$267/Sq Ft
Est. Value
About This Home
This home is located at 11 King St, Warwick, RI 02886 and is currently estimated at $533,971, approximately $267 per square foot. 11 King St is a home located in Kent County with nearby schools including Nel/Cps Construction Career, Islamic School of Rhode Island, and St Joseph School.
Ownership History
Date
Name
Owned For
Owner Type
Purchase Details
Closed on
Jun 24, 2019
Sold by
Warwick City Of
Bought by
Rhode Island Housing & Mtg
Current Estimated Value
Purchase Details
Closed on
Oct 24, 2002
Sold by
Cannistraci Joseph and Cannistraci Denise E
Bought by
Ortiz Jose and Ortiz Myrna
Home Financials for this Owner
Home Financials are based on the most recent Mortgage that was taken out on this home.
Original Mortgage
$135,000
Interest Rate
6.2%
Mortgage Type
Purchase Money Mortgage
Purchase Details
Closed on
Jun 4, 1990
Sold by
Carpano Francis G
Bought by
Cannistraci Joseph J
Home Financials for this Owner
Home Financials are based on the most recent Mortgage that was taken out on this home.
Original Mortgage
$89,600
Interest Rate
10.25%
Mortgage Type
Purchase Money Mortgage
Create a Home Valuation Report for This Property
The Home Valuation Report is an in-depth analysis detailing your home's value as well as a comparison with similar homes in the area
Home Values in the Area
Average Home Value in this Area
Purchase History
| Date | Buyer | Sale Price | Title Company |
|---|---|---|---|
| Rhode Island Housing & Mtg | $5,675 | -- | |
| Rhode Island Housing & Mtg | $5,675 | -- | |
| Ortiz Jose | $150,000 | -- | |
| Ortiz Jose | $150,000 | -- | |
| Cannistraci Joseph J | $112,000 | -- | |
| Cannistraci Joseph J | $112,000 | -- |
Source: Public Records
Mortgage History
| Date | Status | Borrower | Loan Amount |
|---|---|---|---|
| Previous Owner | Cannistraci Joseph J | $135,000 | |
| Previous Owner | Cannistraci Joseph J | $89,600 |
Source: Public Records
Tax History
| Year | Tax Paid | Tax Assessment Tax Assessment Total Assessment is a certain percentage of the fair market value that is determined by local assessors to be the total taxable value of land and additions on the property. | Land | Improvement |
|---|---|---|---|---|
| 2025 | $7,196 | $566,600 | $101,600 | $465,000 |
| 2024 | $6,342 | $438,300 | $85,500 | $352,800 |
| 2023 | $6,219 | $438,300 | $85,500 | $352,800 |
| 2022 | $5,263 | $281,000 | $49,500 | $231,500 |
| 2021 | $5,263 | $281,000 | $49,500 | $231,500 |
| 2020 | $5,263 | $281,000 | $49,500 | $231,500 |
| 2019 | $5,263 | $281,000 | $49,500 | $231,500 |
| 2018 | $4,607 | $221,500 | $52,600 | $168,900 |
| 2017 | $4,483 | $221,500 | $52,600 | $168,900 |
| 2016 | $4,483 | $221,500 | $52,600 | $168,900 |
| 2015 | $4,133 | $199,200 | $54,400 | $144,800 |
| 2014 | $3,996 | $199,200 | $54,400 | $144,800 |
| 2013 | $3,942 | $199,200 | $54,400 | $144,800 |
Source: Public Records
Map
Nearby Homes
- 5 High St
- 36 Bleachery Ct
- 14 W Natick Rd
- 115 Edman St
- 123 Edman St
- 10 East St Unit 316
- 1027 Providence St Unit 4B
- 892 Halifax Dr
- 69 Haverhill Ave
- 122 Edaville Ct
- 816 Williamsbug Cir Unit 816
- 833 Halifax Dr
- 12 Railroad Row
- 50 Briarwood Rd
- 165 Graystone St
- 14 Amanda St
- 6 Lillian Ct
- 333 Greenwood Ave
- 42 Woodland Dr
- 61 Crossland Rd
Your Personal Tour Guide
Ask me questions while you tour the home.