11 Kneeland Rd Tewksbury, MA 01876
Estimated Value: $509,000 - $655,000
2
Beds
1
Bath
1,032
Sq Ft
$544/Sq Ft
Est. Value
About This Home
This home is located at 11 Kneeland Rd, Tewksbury, MA 01876 and is currently estimated at $561,000, approximately $543 per square foot. 11 Kneeland Rd is a home located in Middlesex County with nearby schools including Heath-Brook Elementary School and Abundant Life Christian School and Childcare.
Ownership History
Date
Name
Owned For
Owner Type
Purchase Details
Closed on
Apr 10, 2019
Sold by
Sawyer Patricia A
Bought by
Sawyer Patricia A and Sawyer R
Current Estimated Value
Purchase Details
Closed on
Oct 13, 2000
Sold by
Flynn Jack and Flynn Thelma M
Bought by
Sawyer Patricia A
Create a Home Valuation Report for This Property
The Home Valuation Report is an in-depth analysis detailing your home's value as well as a comparison with similar homes in the area
Home Values in the Area
Average Home Value in this Area
Purchase History
| Date | Buyer | Sale Price | Title Company |
|---|---|---|---|
| Sawyer Patricia A | -- | -- | |
| Sawyer Patricia A | $200,000 | -- |
Source: Public Records
Mortgage History
| Date | Status | Borrower | Loan Amount |
|---|---|---|---|
| Previous Owner | Sawyer Patricia A | $15,000 | |
| Previous Owner | Sawyer Patricia A | $50,000 |
Source: Public Records
Tax History Compared to Growth
Tax History
| Year | Tax Paid | Tax Assessment Tax Assessment Total Assessment is a certain percentage of the fair market value that is determined by local assessors to be the total taxable value of land and additions on the property. | Land | Improvement |
|---|---|---|---|---|
| 2025 | $5,909 | $447,000 | $257,100 | $189,900 |
| 2024 | $5,707 | $426,200 | $244,900 | $181,300 |
| 2023 | $5,601 | $397,200 | $222,700 | $174,500 |
| 2022 | $5,332 | $350,800 | $193,700 | $157,100 |
| 2021 | $4,870 | $309,800 | $166,700 | $143,100 |
| 2020 | $4,692 | $293,800 | $158,800 | $135,000 |
| 2019 | $4,489 | $283,400 | $151,200 | $132,200 |
| 2018 | $4,173 | $258,700 | $151,200 | $107,500 |
| 2017 | $3,960 | $242,800 | $151,200 | $91,600 |
| 2016 | $3,836 | $234,600 | $151,200 | $83,400 |
| 2015 | $3,814 | $233,000 | $157,900 | $75,100 |
| 2014 | $3,559 | $220,900 | $157,900 | $63,000 |
Source: Public Records
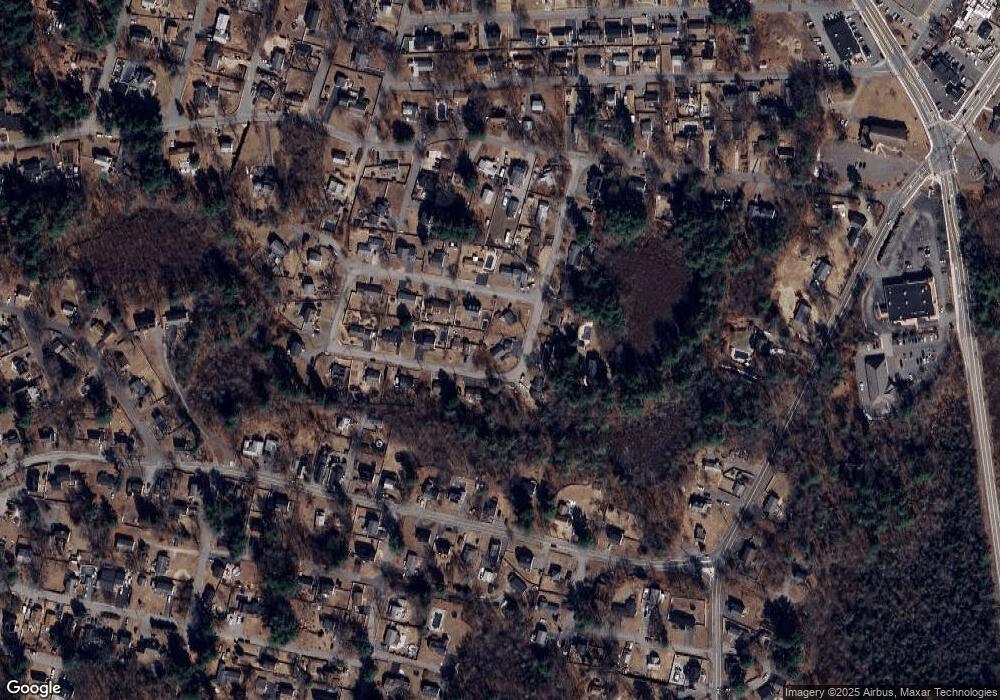
Map
Nearby Homes